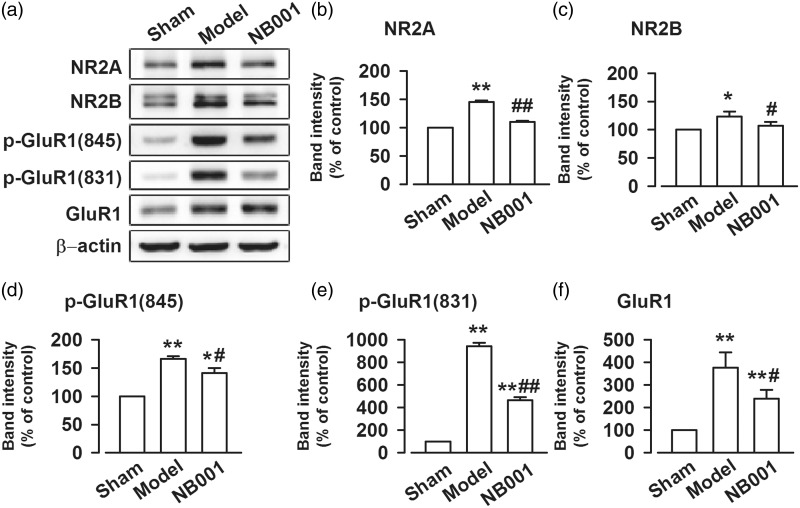
Figure 4.
The expression of NMDAR and AMPAR in bone cancer pain. (a) Representative bands of GluN2A, GluN2B, GluA1, p-GluA1(S831), and p-GluA1(S845) after saline or NB001 treatment in bone cancer mice. (b) to (f) Western blot analysis GluN2A, GluN2B, GluA1, p-GluA1(S831), and p-GluA1(S845) in total homogenates of ACC in bone cancer mice. Data are presented as mean ± SE, *p < 0.05 **p < 0.01 vs. Sham; #p < 0.05, ##p < 0.01 vs. model.

