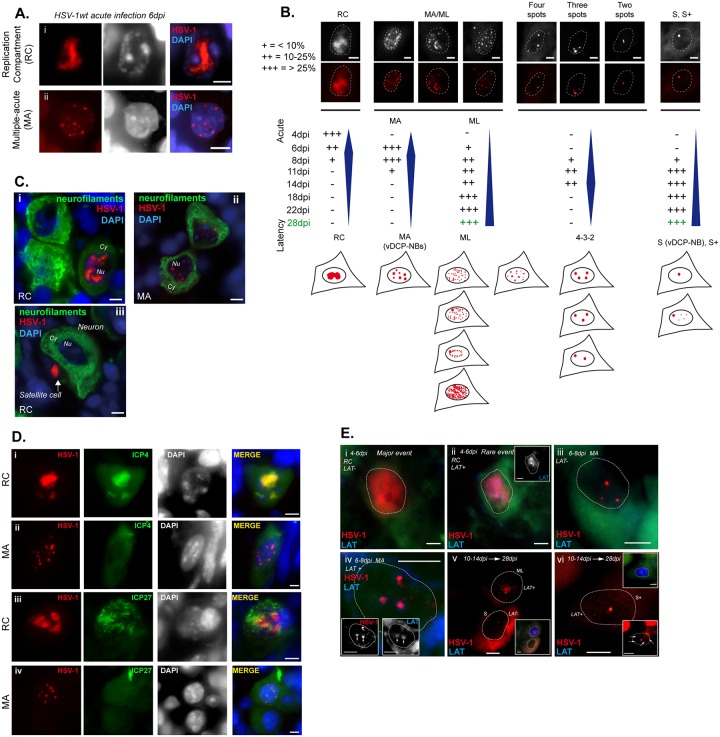
Fig 1. Characterization of herpes simplex virus 1 (HSV-1) genomes during establishment of latency.
(A) DNA-FISH detection of HSV-1 genomes (red). (i) HSV-1 replication compartment (RC) pattern (ii) HSV-1 multiple-acute (MA) pattern. Black/white middle images represent staining of the cellular DNA with DAPI. (B) The HSV-1 genome patterns detected during establishment of latency (from 4 to 28 dpi) are presented as colored and black-and-white DNA-FISH images (up), and drawings (down). Patterns detected were: RC; MA; multiple-latency (ML); four, three, two spots (4-3-2); and single (S) or single+ (S+). The relative proportions of each pattern are signified by “+” or “–“.“-“: pattern was not observed; “+”: less than 10% of the observed patterns; “++”: between 10% and 25% of the patterns; and “+++”: more than 25% of the patterns. Dashed lines indicate nuclei. (C) Immuno-DNA-FISH showing HSV-1 genomes (red, 6 dpi), neurofilament (NF160) protein (green), and cellular chromatin (DAPI, blue). Nu: nucleus; Cy: cytoplasm. (D) Immuno-DNA-FISH showing HSV-1 genomes (red, 6 dpi), viral proteins (green), and cellular chromatin (DAPI, blue/grey). (E) RNA-DNA FISH showing HSV-1 genomes (red) and LAT (blue/grey). Inset at top right in (vi) shows LAT expression; inset at bottom right in (vi) shows the same image overexposed to visualize the small viral dots (arrows) present in the nucleoplasm. RC: Replication Compartment; MA: multiple-acute; ML: multiple-latency; S: single; S+: single +. Scale bars represent 10 μm.

