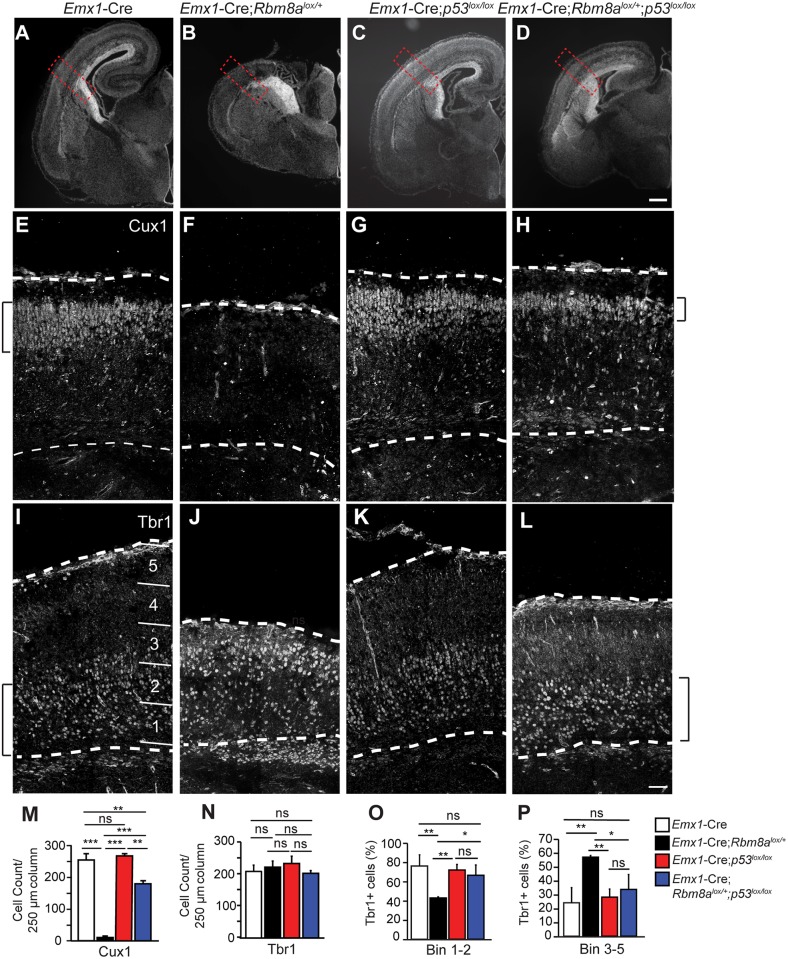
Fig 10. Loss of p53 partially rescues neuron number and distribution associated with Rbm8a haploinsufficiency.
(A-D) Coronal sections of E18.5 brains of indicated genotypes stained with Hoechst (white). (E-L) Regions of coronal sections indicated in (A-D, red dotted square) stained for Cux1 (E-H) and Tbr1 (I-L). (M, N) Quantification of Cux1+ (M) and Tbr1+ (N) density within a 250 μm radial column for indicated genotypes. (O, P) Bar graphs depicting density of Tbr1+ neurons in VZ/SVZ (bin 1–2, O) and cortical plate (bin 3–5, P) of indicated genotypes. Bins were quantified as indicated in I. Brackets denote general boundaries of Cux1 and Tbr1 layers. ANOVA with Tukey posthoc *, p<0.05, **, p<0.01, ***, p<0.001, ns, not significant. Error bars, S.D. n = 2–3 biological replicates each. Scale bars, A-L, 50 μm.

