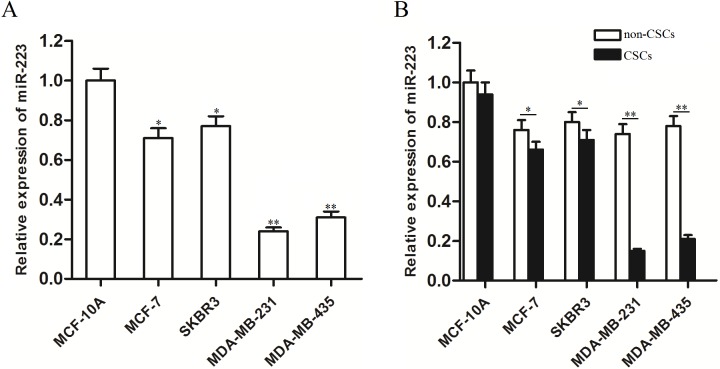
Fig 1. MiR-223 expression levels in breast cancer cell lines.
(A) QRT-PCR analysis showed that the decrease of miR-223 expression was more significant in TNBC cell lines (MDA-MB-231 and MDA-MB-435) than the non-TNBC cell lines (MCF-7 and SKBR3). *P<0.05 vs. MCF-10A cells, t test, **P<0.01 vs. MCF-10A cells, t test. (B) MiR-223 expression was significantly down-regulated in both MDA-MB-231 CSCs and MDA-MB-435 CSCs compared with their parental cells. *P<0.05, t test, **P<0.01, t test.

