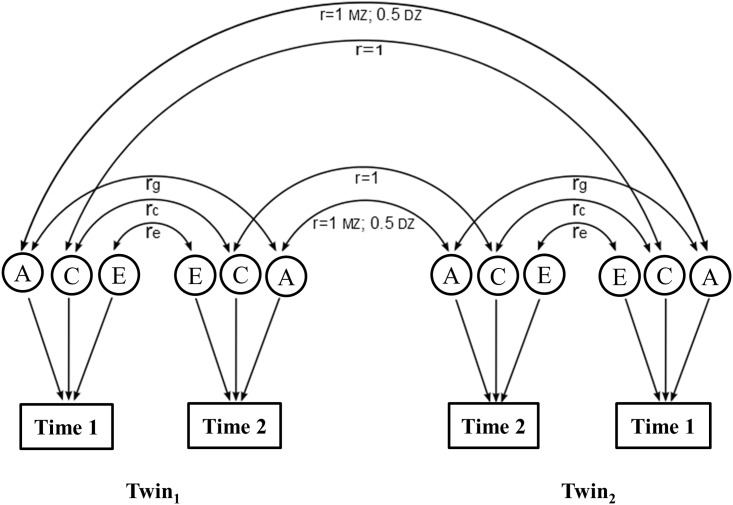
Fig 1. Path diagram of the bivariate twin model applied to longitudinal data assuming additive genetic (A), common environmental (C), and unique environmental (E) components in the variances and covariance of phenotype measurements at time 1 (baseline) and time 2 (follow-up).
The genetic correlation is set 1.0 in MZ twin pairs and 0.5 in DZ twin pairs. The shared environmental correlations is set to 1.0 in all twin pairs; rg, rc, re are the genetic, shared environmental and unique environmental correlations on phenotype levels at the two time points, respectively. Hereof rg can be calculated as , where varg (Time 1), varg (Time 2) are the additive genetic variance of Time 1 and Time 2 respectively, and covg (Time 1,Time 2) is their genetic covariance. Likewise, correlations for common environmental (rc), and unique environmental (re) factors can be calculated.

