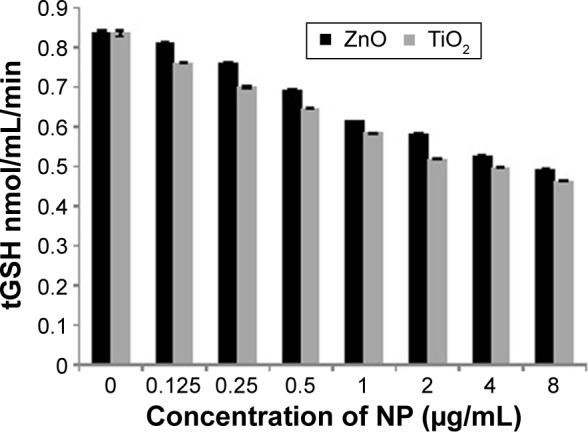
Figure 2.

GSH after NPs exposure.
Notes: The levels of tGSH measured after 24 hours exposure of MRC5 cells to TiO2 and ZnO. Results are expressed as the nmol of the tGSH level per mg of protein. Data are presented with a mean ± SE of at least three independent experiments.
Abbreviations: GSH, glutathione; NPs, nanoparticles; SE, standard error; tGSH, total glutathione; TiO2, titanium dioxide; ZnO, zinc oxide.
