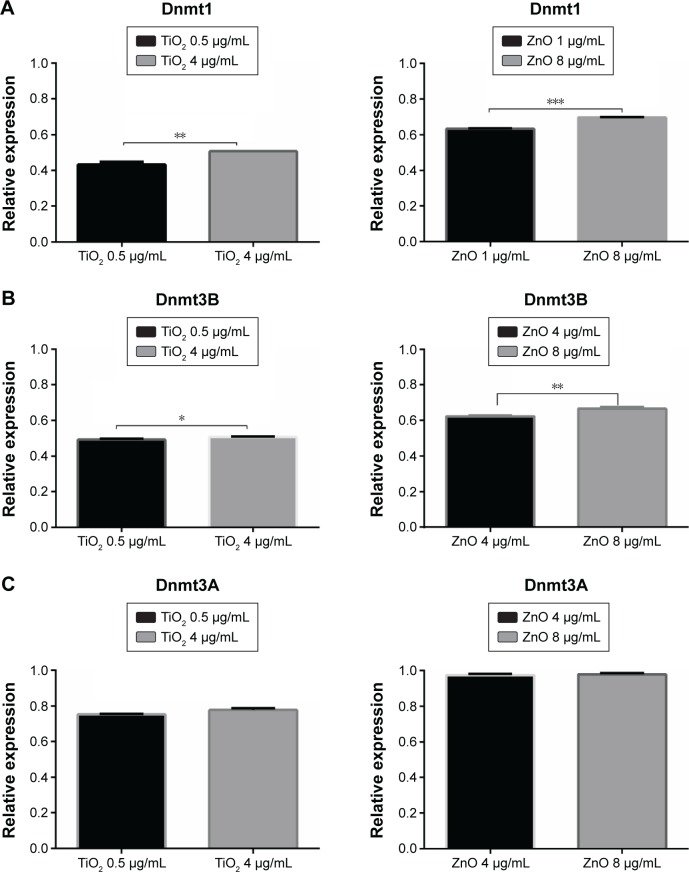
Figure 5.
Differential expression of Dnmts.
Notes: (A) Representative results of fold change difference of Dnmt1. (B) Representative results of fold change difference of Dnmt3B. (C) Representative results of fold change difference of Dnmt3A. Data are expressed as the mean ± SEM in three independent experiments, representing the relative levels with normalization by 18S ribosomal RNA. The fold differences were calculated compared with control groups and shown in the figure. *P<0.007; **P<0.01; ***P<0.05.
Abbreviations: SEM, standard error of the mean; TiO2, titanium dioxide; ZnO, zinc oxide.

