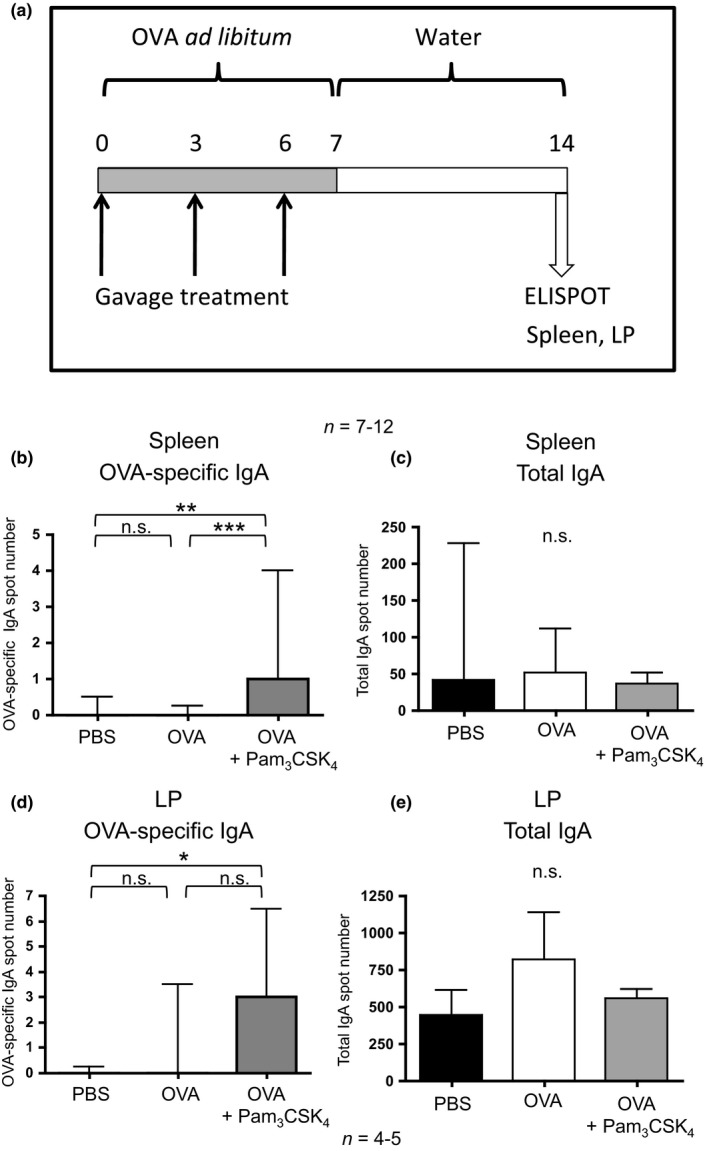
Figure 4.

Antigen‐specific IgA‐producing B cells are enhanced by oral Pam3 CSK 4 treatment. (a) BALB/c mice were treated by gavage with OVA ± Pam3 CSK 4 with OVA provided ad libitum over 1 week. Control mice were treated with PBS by gavage and water ad libitum (not depicted). On day 14, spleens and LP were harvested and cultured for ELISPOT analysis. Spot number was compared between groups on the basis of OVA‐specific IgA‐producing cells in the spleen (b) and LP (d), and non‐specific total IgA‐producing cells in the spleen (c) and LP (e). Spot numbers were compared between groups by Kruskal–Wallis test followed by Dunn's multiple comparison test. Bars represent median spot number/1 × 106 cells with interquartile range. *P < 0.05, **P < 0.01, ***P < 0.001, n.s., not significant.
