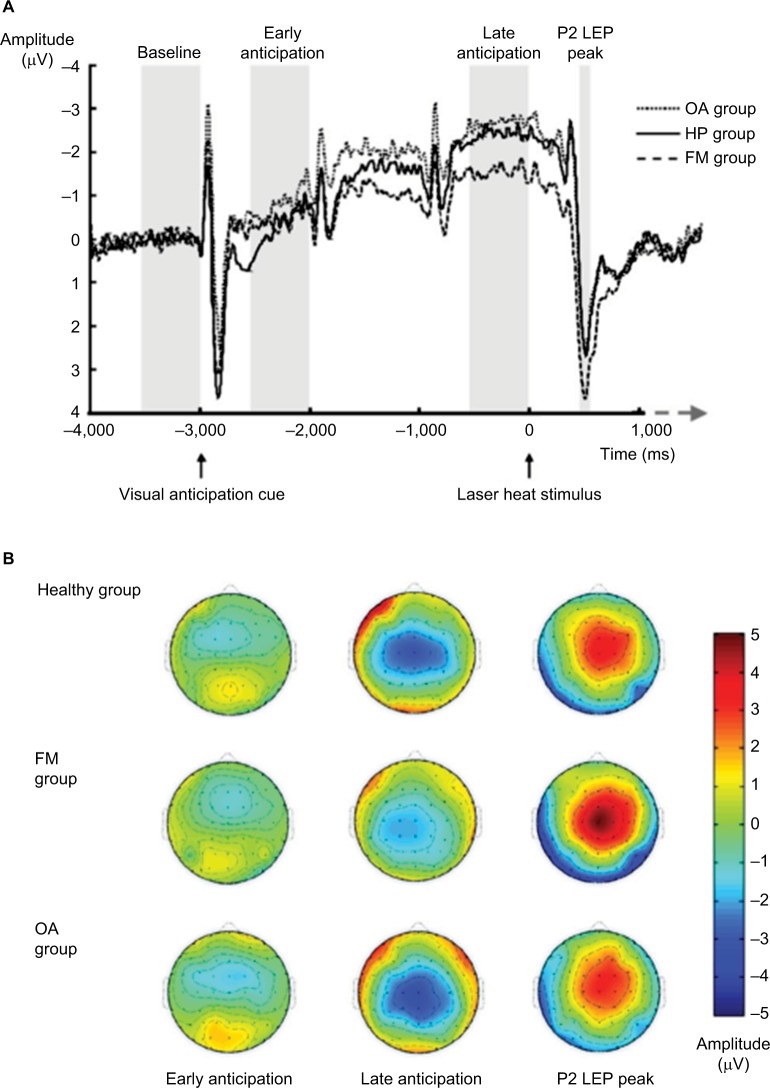
Figure 3.
An example figure produced by an EEG study.
Notes: (A) Grand average waveforms for each group. (B) Grand average topographic maps for each group. EEG ERP waveforms and topography plots of experimental heat pain elicited onto patients and healthy volunteers. This diagram illustrates how EEG analysis can be used to split cerebral activation of pain into separate temporal components, early/late anticipation and the peak evoked by pain. In addition, the topographic maps illustrate the reduced spatial resolution provided by EEG. Red regions indicate areas of increased activation analysis Copyright © 2013 Federation of European Neuroscience Societies and John Wiley & Sons Ltd. Reproduced with Brown CA, El-Deredy W, Jones AK. When the brain expects pain: common neural responses to pain anticipation are related to clinical pain and distress in fibromyalgia and osteoarthritis. Eur J Neurosci. 2014;39(4):663–672.37
Abbreviations: EEG, electroencephalography; ERP, event-related potential; OA, osteoarthritis; FM, fibromyalgia; ms, millisecond; LEP, laser evoked potential.

