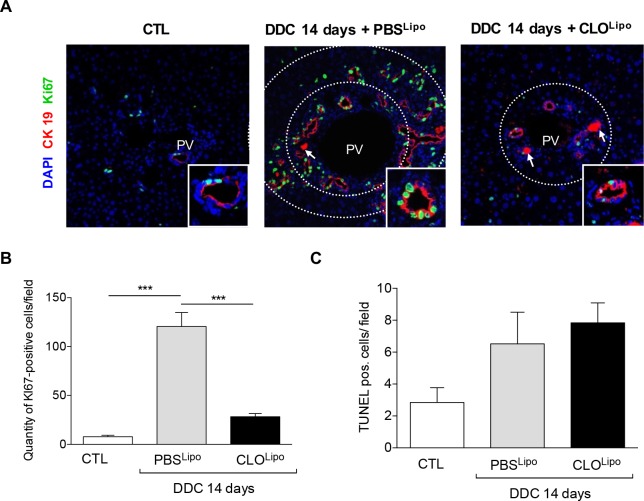
Fig 4. Under macrophage depletion proliferation of CK19 positive ductules in the portal region is inhibited.
(A) Liver sections of the same mouse collective were co-stained with CK19/Ki67 to visualize the proliferation index. All images were taken in 40x original magnification. PV = Portal vein. White arrow indicating porphyrin deposition. (B) To quantify the proliferation index, the quantity of Ki 67-positive cells/field was determined. (C) To obtain the extent of apoptosis, TUNEL stainings were carried out (S8 Fig) and the amount of TUNEL pos. cells per field was quantified. All stainings and quantifications were performed as described in materials and methods. All data are presented as mean ± SEM for n = 5/group, ***p<0.001.

