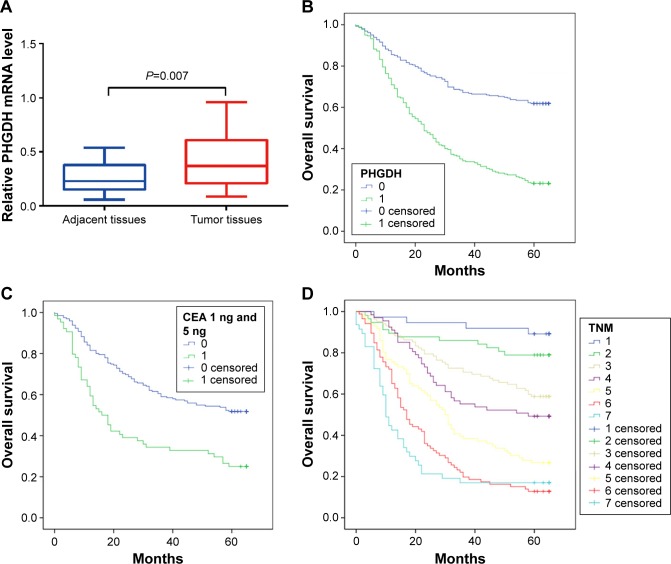
Figure 2.
Kaplan–Meier survival curves for gastric cancer, with comparisons evaluated using the log-rank test.
Notes: (A) PHGDH mRNA levels in GC specimens determined by real-time PCR. PHGDH mRNA was significantly higher in GC tissues than in their paired peritumoral counterparts (P=0.007). (B) Overall survival was significantly shorter in patients with PHGDH-high expression (green line: 1) vs PHGDH-low expression (blue line: 0). (C) Overall survival was significantly shorter in patients with preoperative CEA-high levels (green line: 1) vs CEA-low levels (blue line: 0). (D) Advanced TNM stage significantly worsened overall survival compared with early TNM stage: TNM IIIc and IV (light blue line: 7), TNM IIIb (red line: 6), TNM IIIa (yellow line: 5), TNM IIb (purple line: 4), TNM IIa (light yellow line: 3), TNM Ib (green line: 2), and TNM Ia +0 (blue line: 1).
Abbreviations: CEA, carcinoembryonic antigen; GC, gastric cancer; PCR, polymerase chain reaction; PHGDH, phosphoglycerate dehydrogenase; mRNA, messenger RNA; TNM, tumor node metastasis.

