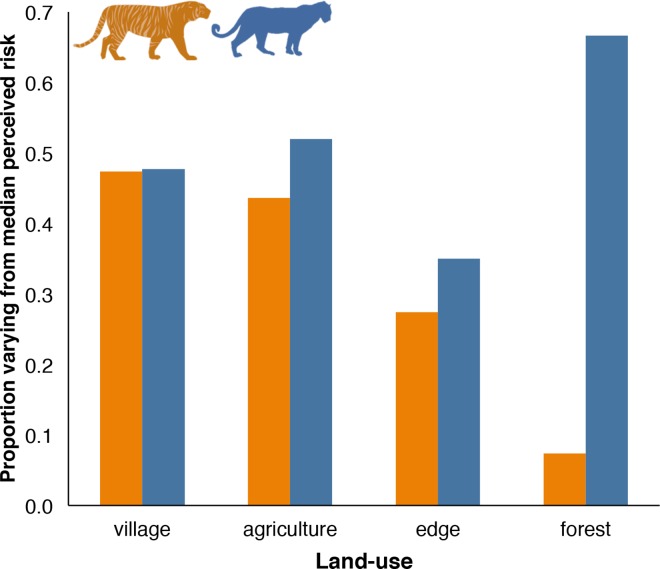
Fig 5. Variation in individual owners’ perceived risk within each land-use category.
Variation was calculated as the proportion of owners that deviated from the median perceived risk level. Larger values represent greater variation between owners’ responses and lower overall alignment in owners' perceptions of risk. Perceived risk from tigers is shown in orange and from leopards is shown in blue.

