Figure 3.

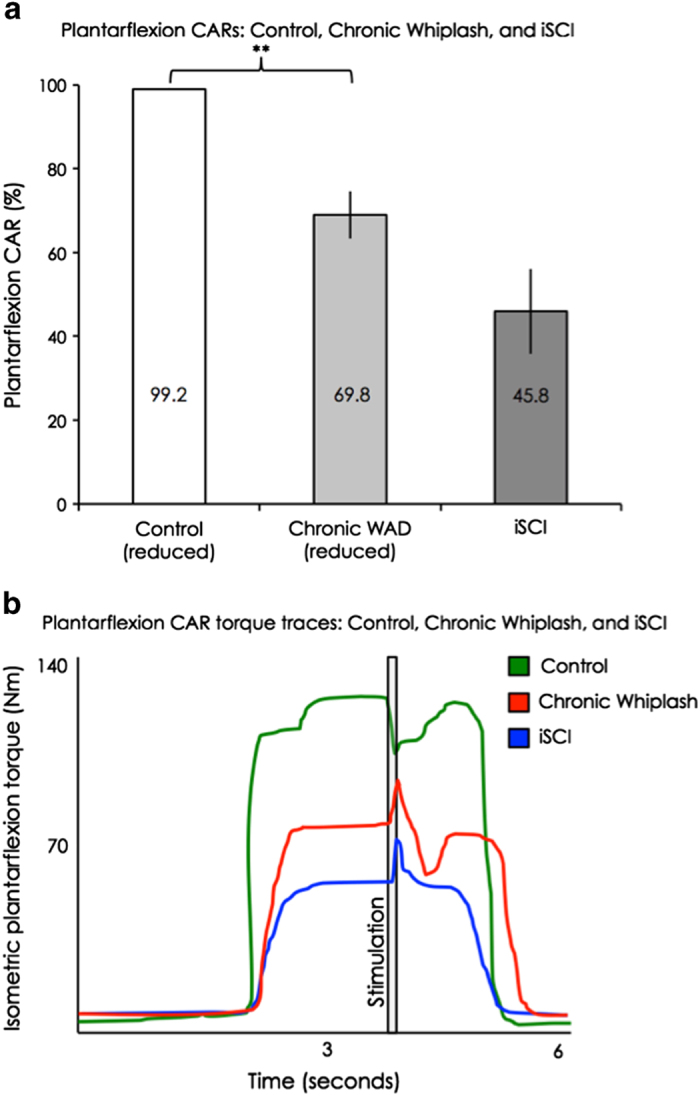
(a) Group means and s.e.m. of the plantarflexion central activation ratios on the reduced side, for the control, chronic WAD and iSCI groups. A significant difference was found comparing control with chronic WAD (P<0.01), but not comparing chronic WAD with iSCI (P=0.07). (b) Plantarflexion torque traces for central activation testing for one uninjured control participant, one representative with chronic WAD and one representative with iSCI.
