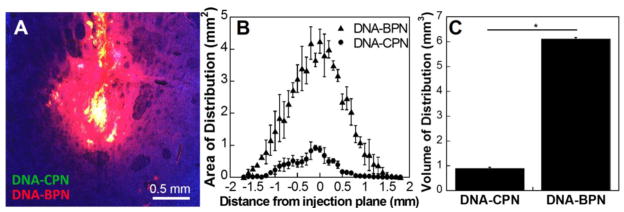
Figure 4. DNA nanoparticle distribution following CED.
(A) Representative distribution of DNA nanoparticles in rodent striatum; blue – nuclear stain (DAPI), green – Cy3 labeled DNA-CPN, red – Cy5 labeled DNA-BPN, yellow – co-localization of DNA-CPN and DNA-BPN; Scale bar: 0.5 mm. (B) Area of distribution of DNA nanoparticles in the coronal plane as a function of distance from injection site and (C) volume of distribution of DNA nanoparticles quantified from confocal images of consecutive 100 mm slices. Data represents the mean ± SEM. * Denotes statistical significance p < 0.05.

