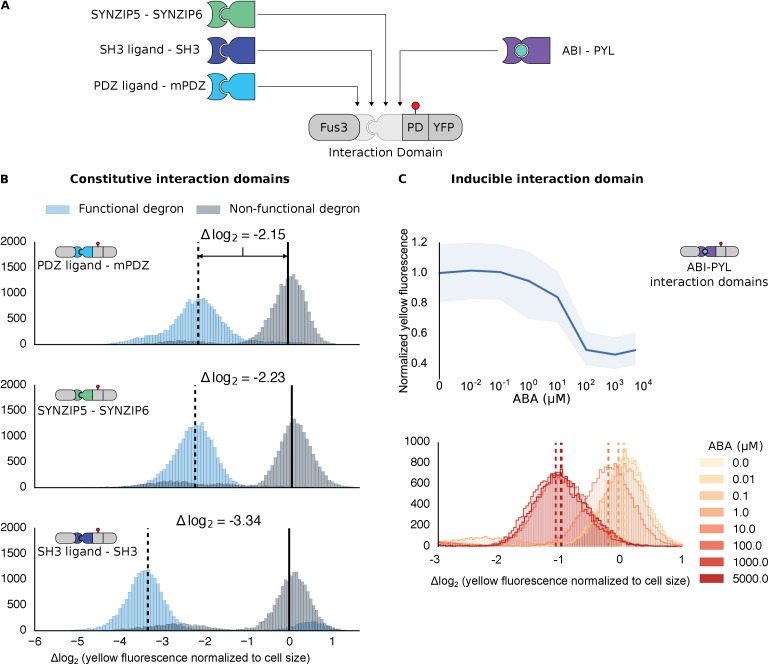
Figure 2. Demonstrating the flexibility and scalability of the system by varying interaction domains.
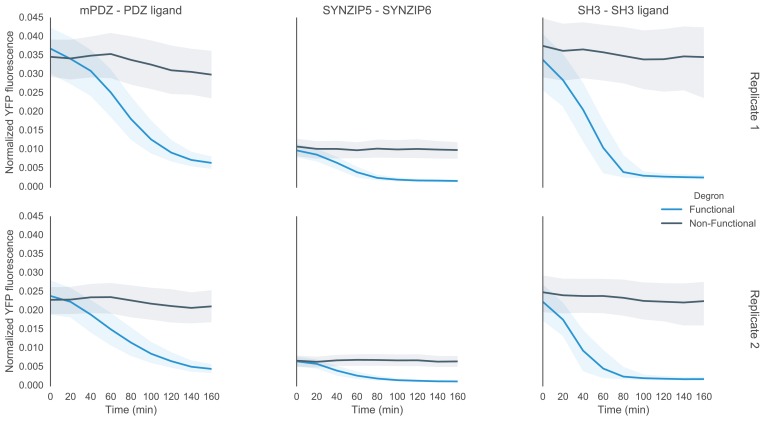
(A) Variants of the different complementary interaction domains used. The constitutive interaction domains mPDZ, SH3 and SYNZIP are shown on the left; the ABA inducible ABI-PYL interaction domains appear on the right. (B) Comparison of YFP signal normalized by cell size from constructs bearing the indicated interaction domains along with either a functional (blue histograms) or non-functional (gray histograms) phosphodegron in yeast treated with 10 μM α-factor as in Figure 1C. The vertical dashed black lines on the histograms represent the medians of the populations with functional degrons whereas the solid black lines represent the median of the populations with non-functional degrons. (C) Median fluorescence – shaded regions cover the interquartile range – and population histograms of the YFP signal normalized to cell size from cells expressing the ABA inducible ABI-PYL interaction domains fused to Fus3 and YFP, respectively for a range of ABA concentrations. The raw time-course data corresponding to these endpoint observations can be found in Figure 2—figure supplement 1.


