. 2016 Aug 15;5:e15200. doi: 10.7554/eLife.15200

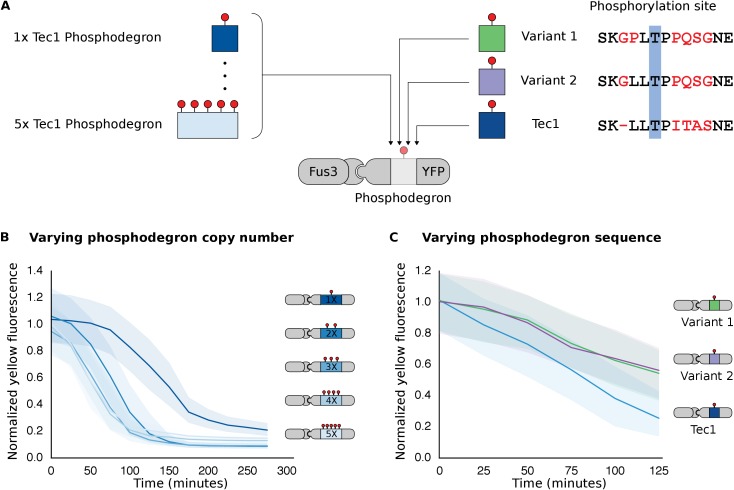
Figure 4. Modulating regulation by altering the number and sequence of phosphodegrons.

(A) We varied either the phosphodegron number (left) or the sequence (right)—differing residues are red, the phosphorylated residue is highlighted in blue. (B) Time-course data of strains induced with 10 μM α-factor and expressing Fus3 targeting YFP reporters with one to five phosphodegrons. The fluorescence of each strain was normalized to cell size and then to its initial fluorescence. Data normalized only to cell size can be found in Figure 3—figure supplement 1. (C) Fus3 targeting of YFP substrates with the indicated phosphodegron sequence variants. As in B), the fluorescence of each strain is normalized to cell size and then against its initial fluorescence. Data normalized only to cell size can be found in Figure 3—figure supplement 2. The curves indicate the median values, while the shaded regions cover the interquartile range.

DOI: http://dx.doi.org/10.7554/eLife.15200.013

Figure 4.

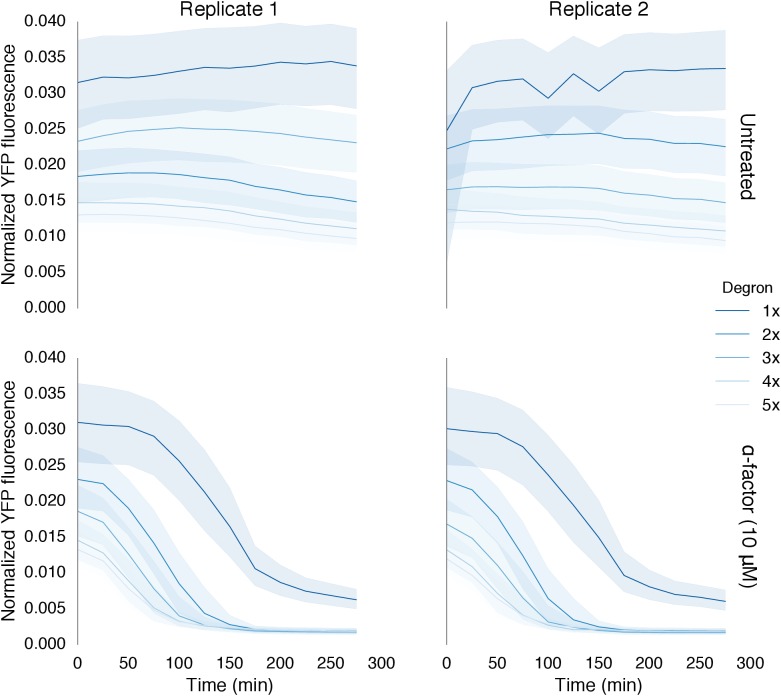
Figure 4—figure supplement 1. Time course data of reporter variants with different numbers of phosphodegrons normalized by cell size.

Figure 4—figure supplement 1.

Each subplot in this plot is a replicate of the experiment performed on different days under identical conditions. Each yeast strain assayed was diluted from a saturated culture, grown for 5 hours to reach log phase growth and then induced with 10 μM α-factor at time 0 to activate the kinase. The fluorescence of these cultures was then assayed at regular intervals using flow cytometry. Data for each variant is depicted in a different color with dark blue being one degron and light blue being five adjacent degrons. Solid lines indicate the median value, while shaded regions indicate the interquartile range.
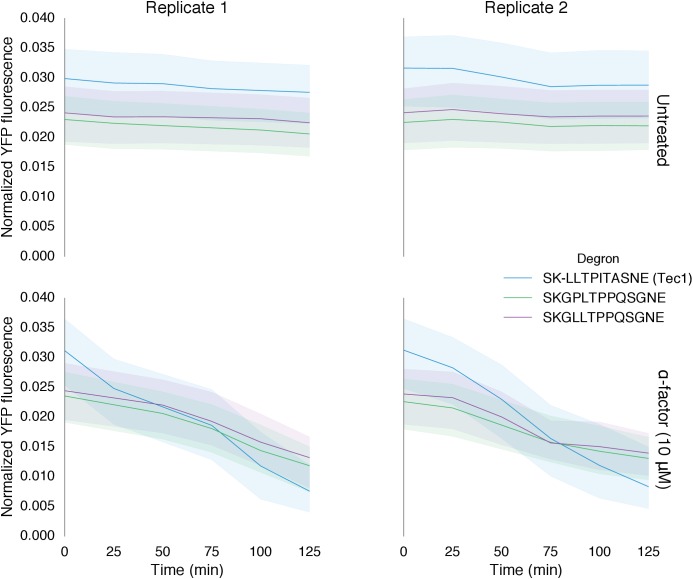
Figure 4—figure supplement 2. Time course data of reporter variants with different degron sequences normalized by cell size.

Figure 4—figure supplement 2.

Each yeast strain assayed was grown up to log phase from saturated cultures for 5 hrs and then induced with 10 μM α-factor at time 0 to activate the kinase. The fluorescence of these cultures was then assayed at regular intervals using flow cytometry. Solid lines indicate the median value, while shaded regions indicate the interquartile range.