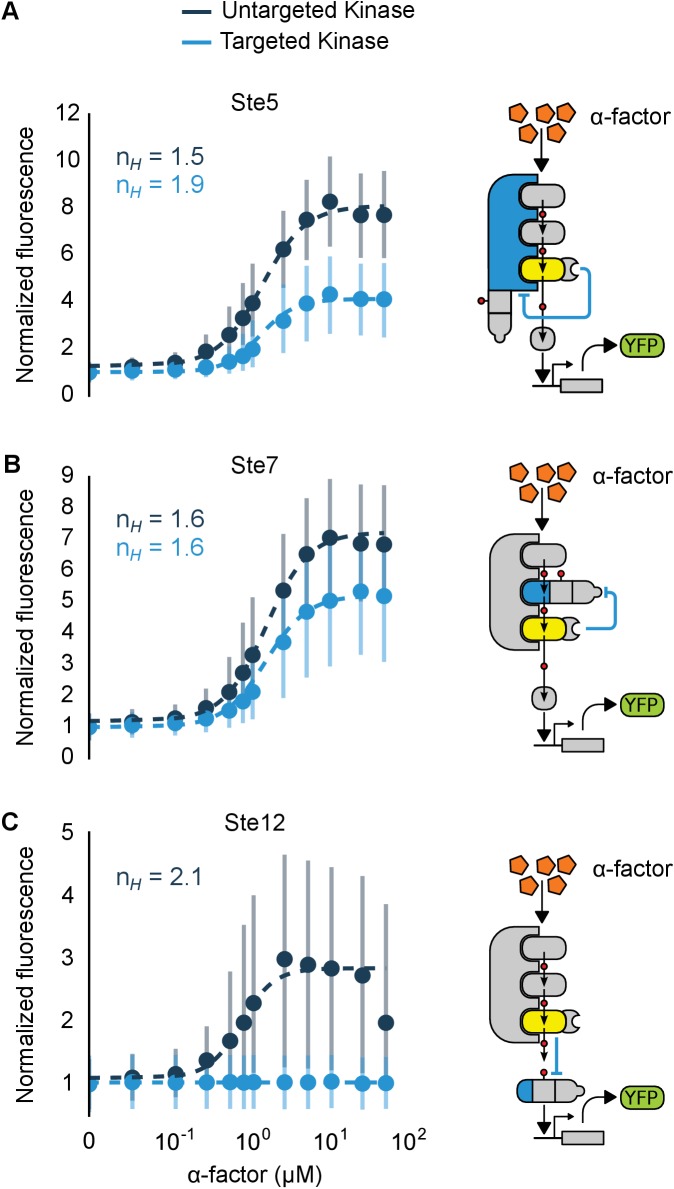
Figure 6. Implementation of negative feedback and feed-forward signaling topologies using a rewired MAPK.
(A–C) Plots and schematics that depict the relationship between the α-factor input and the YFP reporter for yeast strains with synthetic post-translational negative feedback or feed-forward loops. Fus3 (yellow) was rewired to target (A) the scaffold Ste5, (B) the kinase Ste7 or (C) the transcription factor Ste12 (all depicted in light blue)–in each case, the endogenous copies of these proteins were modified by inserting a phosphodegron and a complementary interaction domain at their C-terminus. Plots of the median fluorescence of the YFP reporter – under the control of the mating-specific pFUS1 promoter – normalized to cell size for increasing concentrations of α-factor. Data from control strains with an untargeted kinase – and thus no feedback/feed-forward control – are shown in dark blue. Points indicate the median values at each α-factor concentration, while the vertical bars cover the interquartile range of the data. The data from both the no feedback and feedback conditions were used to determine the parameter values used with the formula: – where was fixed between the two data sets. and ] are the hill coefficient and the α-factor concentration, respectively. Fits are plotted as dashed lines. Time courses of the same strains treated with 10 µM α-factor are shown in Figure 6—figure supplement 1.


