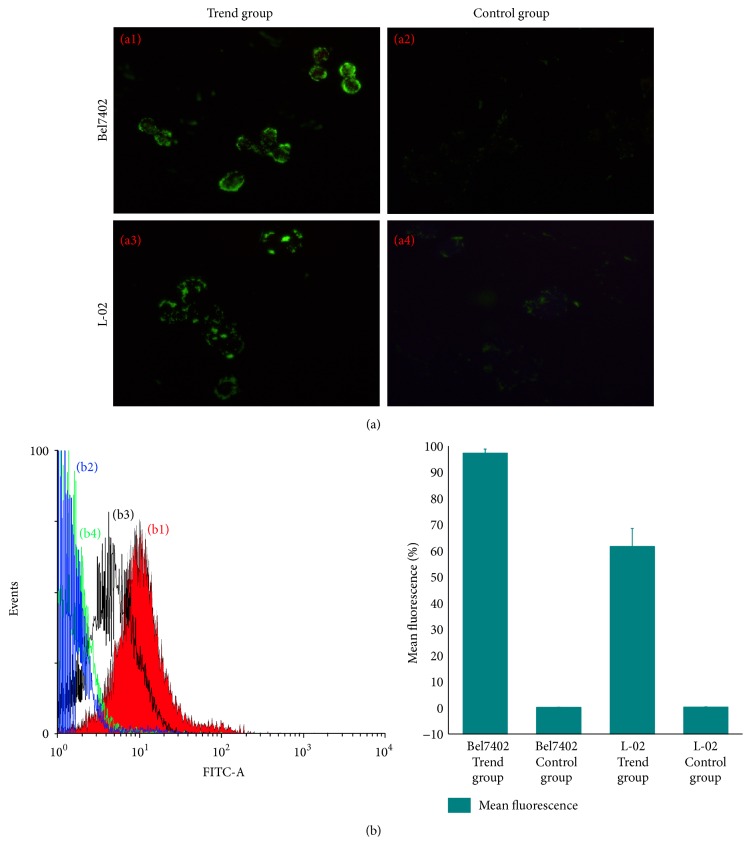
Figure 11.
Fluorescent microscopic images and flow cytometry histogram of cell uptake. (a) Flurorescent microscopic images of cell uptake. (b) Fluorescence-activated cell sorting analysis of uptake: (b1) Bel7402 of trend group; (b2) Bel7402 of control group. (b3) L-02 of trend group and (b4) L-02 of control group.

