Figure 3.

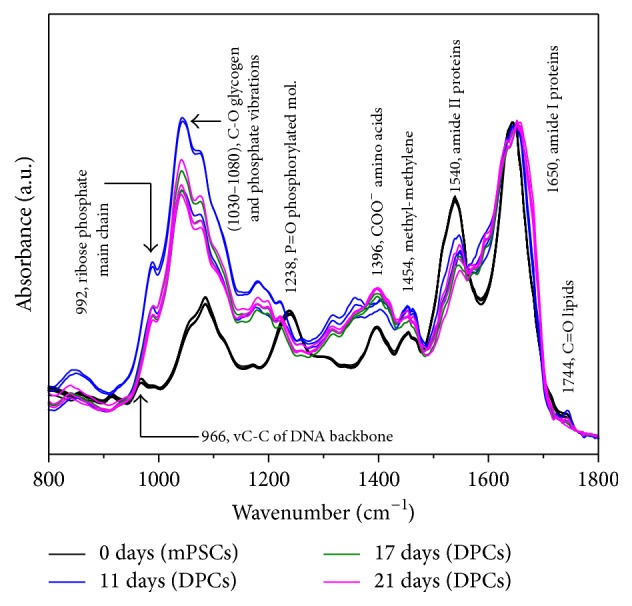
FTIR spectra of mouse pluripotent stem cells (mPSCs) and Differentiated Pancreatic Cells (DPCs) at different maturation stages (11, 17, and 21 days) depicted in the fingerprint region (N = 3).

FTIR spectra of mouse pluripotent stem cells (mPSCs) and Differentiated Pancreatic Cells (DPCs) at different maturation stages (11, 17, and 21 days) depicted in the fingerprint region (N = 3).