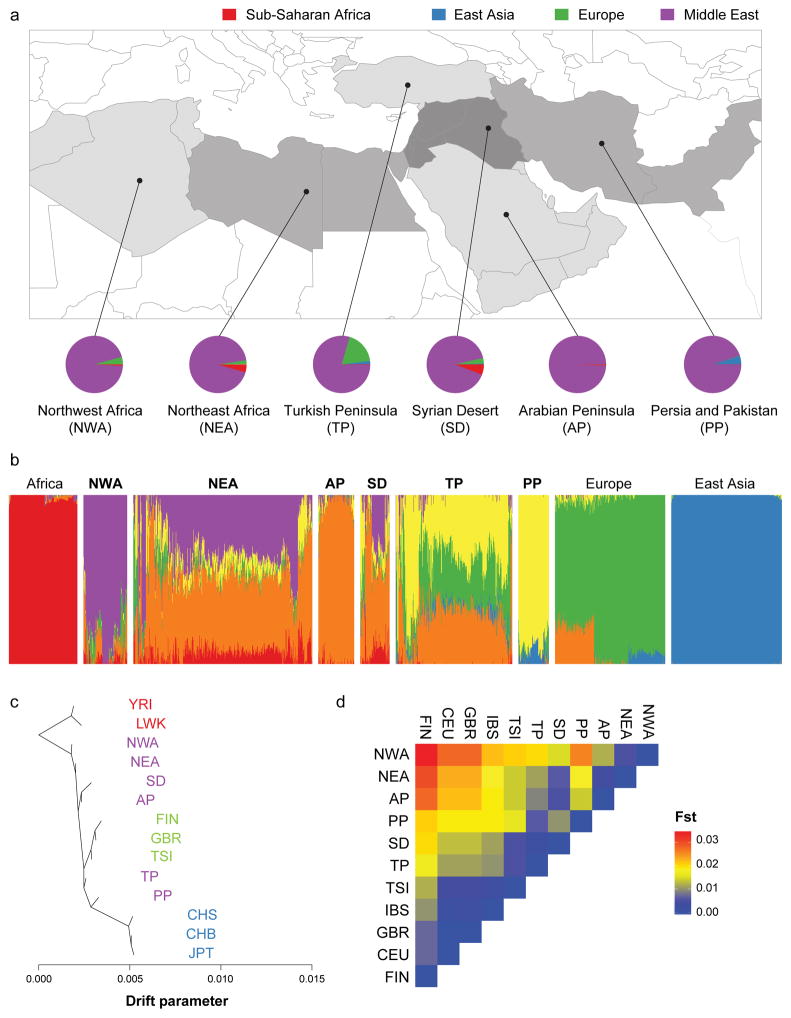
Figure 1. Greater Middle East Variome as a hub of human genetics.
a. Map of GME sub-regions. Lines define borders for admixture analysis from East Asia, Europe, Sub-Saharan Africa and the novel GME contribution (NWA: Northwest Africa, NEA: Northeast Africa, TP: Turkish Peninsula, SD: Syrian Desert, AP: Arabian Peninsula, PP: Persia and Pakistan). Pie charts: admixture proportions of 1000 Genomes Project (1000G) continental populations according to K=6 clusters.
b. Global ancestry proportions (K=6) for 1000G control populations with three distinct sources of contribution. 1000G population contributions: Africa (red), Europe (green) and East Asia (blue). GME populations from west to east: NWA (purple), AP (orange), and PP (yellow) derived from the GME.
c. TreeMix phylogeny of GME along with 1000G controls representing population divergence patterns. Length of the branch proportional to population drift. GME populations grouped around the African branch, but showed a substantial divergence. YRI: Yoruba in Ibadan, LWK: Luhya in Webuye Kenya, FIN: Finnish, GBR: Great Britain, TSI: Toscani, CHS: Southern Han Chinese, CHB: Han Chinese in Beijing, JPT: Japanese in Tokyo.
d. Wright’s Fixation Index (Fst) values for all pairs of GME and 1000G European populations, showing a smaller distance between GME and European populations compared with Sub-Saharan African populations. Greatest Fst value between any two GME populations was 0.026 (i.e. a quarter of the distance between FIN and JPT).

