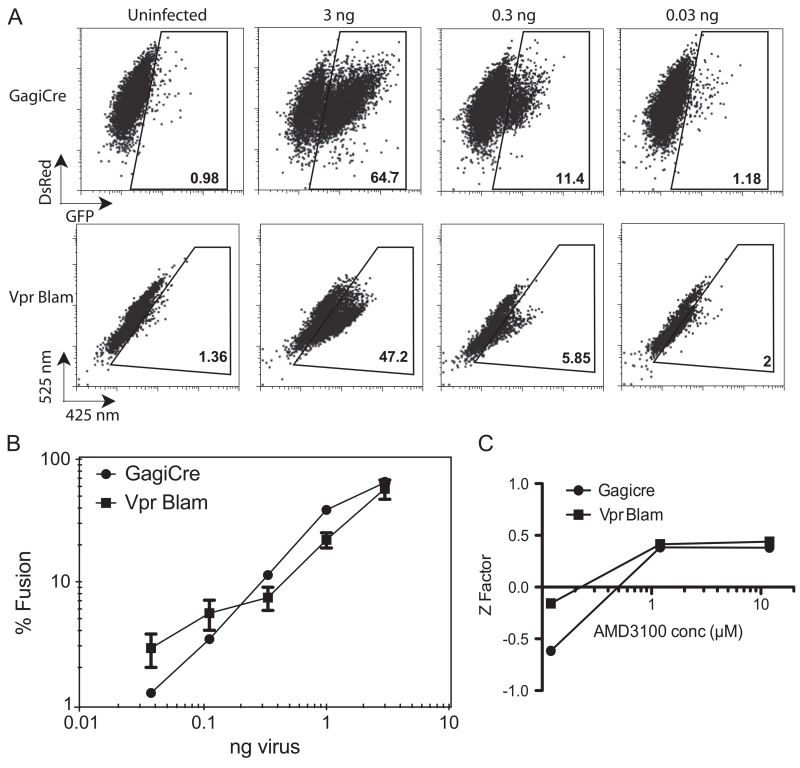
Fig. 4.
HIV Gag-iCre reporter signal is comparable to Vpr Blam. (A) FACS analysis of Jurkat floxRG cells spinoculated with Gag-iCre virus and Jurkat cells spinoculated with NL43 Vpr Blam 16 h after spinnoculation. (B) Dose response plot of viral input versus percent fusion evident in target cells following Gag-iCre of Vpr–Blam assays. Bars represent error from 2 replicates. (C) Z factor plotted as a function of increasing inhibitor concentration for Gag-iCre and Vpr Blam assays.

