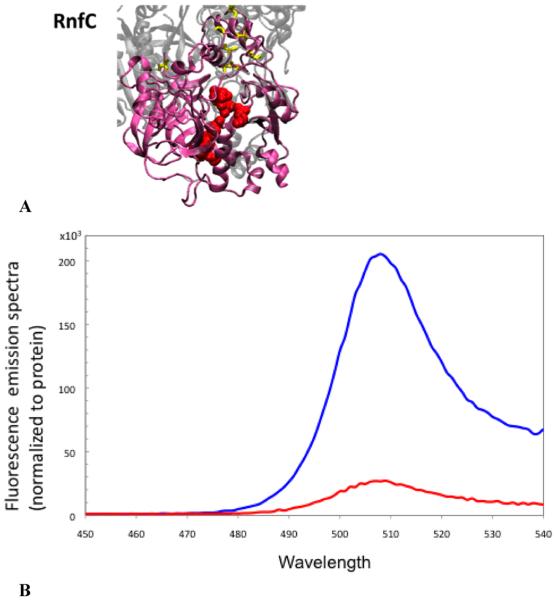
Figure 6.
(A) Structural model of RnfC showing the NADH binding site (G174, G176, G177, A178, F180, P181, A183, K185, L186, N199, C204, and P205) and the cysteine ligands for three FeS centers (yellow) (C405, C408, C411, C415, C444, C447, C450, and C454). The model obtained using Phyre was selected on the basis of comparison to the crystallographic structure of Na+-NQR (ref). (B) Fluorescence emission spectra of the RnfC–GFP fusion protein: membrane fraction (red) and soluble fractions (blue). Spectra were normalized by protein concentration.

