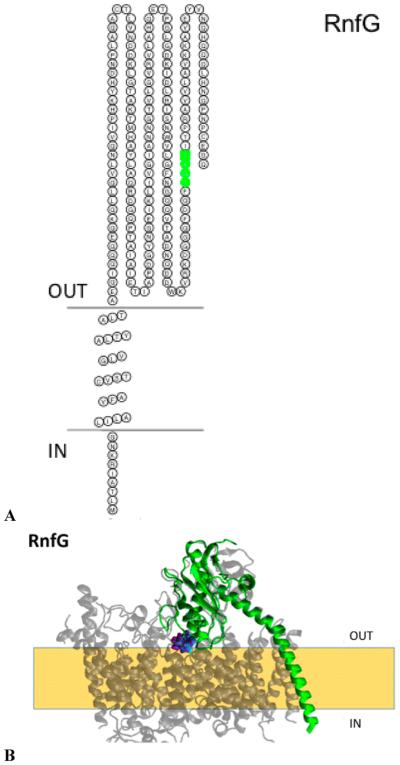
Figure 8.
(A) Membrane topology model of RnfG. The FMN binding site is colored green (T172, G173, A174, and T175). (B) Homology model of RnfG (blue) superimposed on the NqrC (red) structure. The FMN binding site is also shown [RnfG-T1172 (NqrC-S222), RnfG-G173 (NqrC-G223), RnfC-A174 (NqrC-A224), and RnfC-T175 (NqrC-T225)]. The model created using RaptorX was selected as the best model; this selection was made on the basis of comparison to our RnfD topology data and the crystallographic structure of Na+-NQR.

