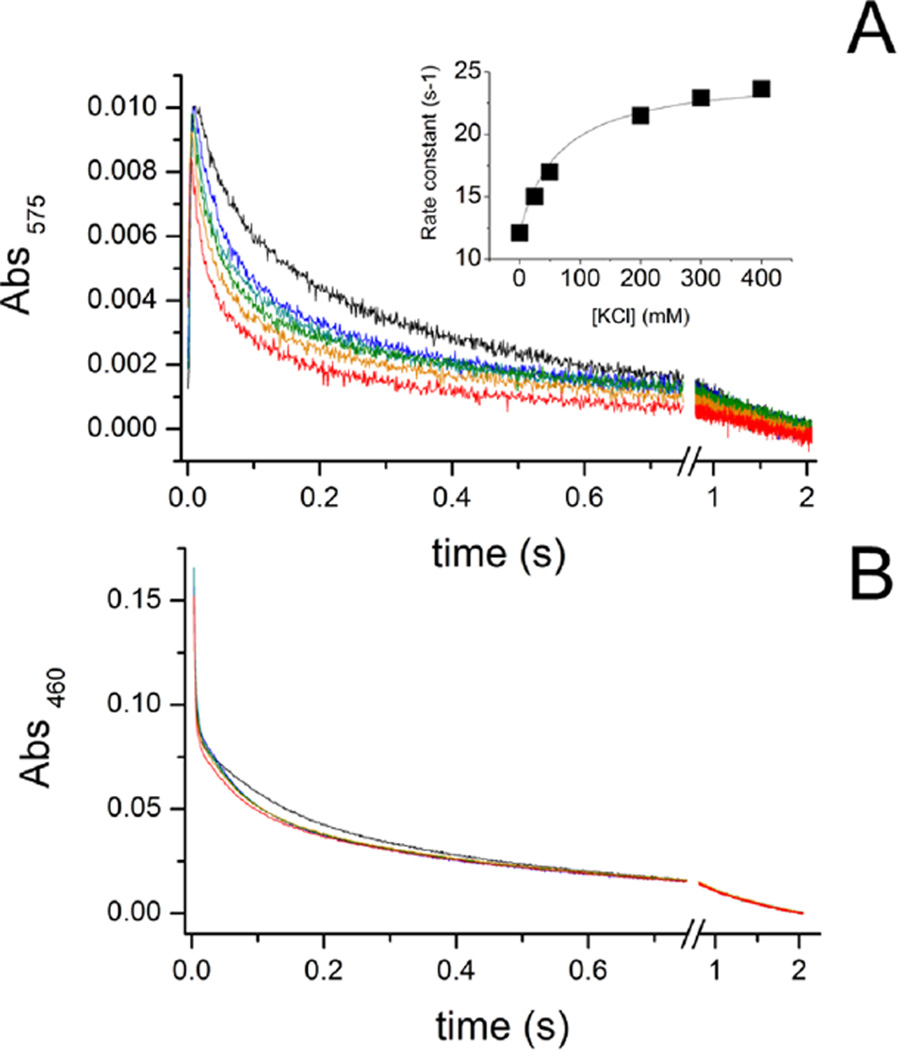
Figure 3.
Time course of reduction of the NqrB-D397N mutant by NADH (300 µM) in the presence of different concentrations of KCl at 575 nm (A) and 460 nm (B): no K+ (black), 25 mM KCl (blue), 50 mM KCl (cyan), 200 mM KCl (green), 300 mM KCl (orange), and 400 mM KCl (red). The inset shows the rate constant of the main K+-dependent phase at 575 nm as a function of K+ concentration. All concentrations after mixing.

