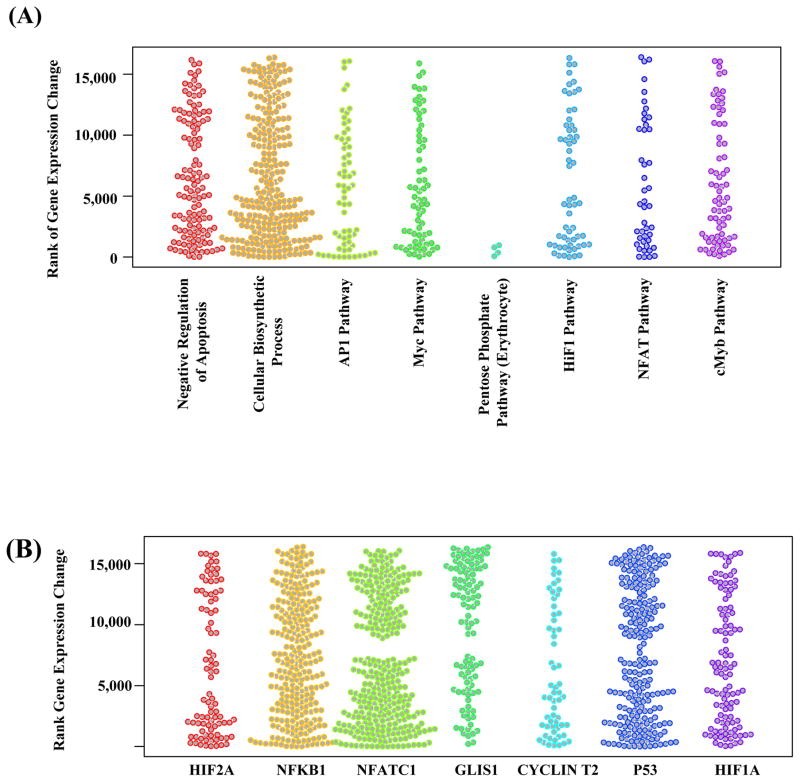
Figure 4.
Stripcharts showing the associations of selected gene sets with the transcriptional response of blood cells to cardiac CTA exposure. (A) Functional gene sets for biological processes, signaling and metabolic pathways. (B) Regulation gene sets for transcription factor target genes. The transcriptome data is obtained through RNA-sequencing of 3 selected individuals before and 24 hours after cardiac CTA. The color groups the genes (shown as dots) in different biological processes/pathways (A) or regulated by different transcription factors (B). The y-axis corresponds to the rank of the gene’s expression changes among 16,486 protein-coding genes. Low ranks correspond to decreased expression of genes after cardiac CTA exposure, high ranks correspond to increased expression. When a set of genes are not associated with cardiac CTA exposure, we expect the ranks of the genes’ expression changes to be evenly distributed, hence an uneven distribution of the dots along the y-axis indicates association of a gene set with cardiac CTA exposure.

