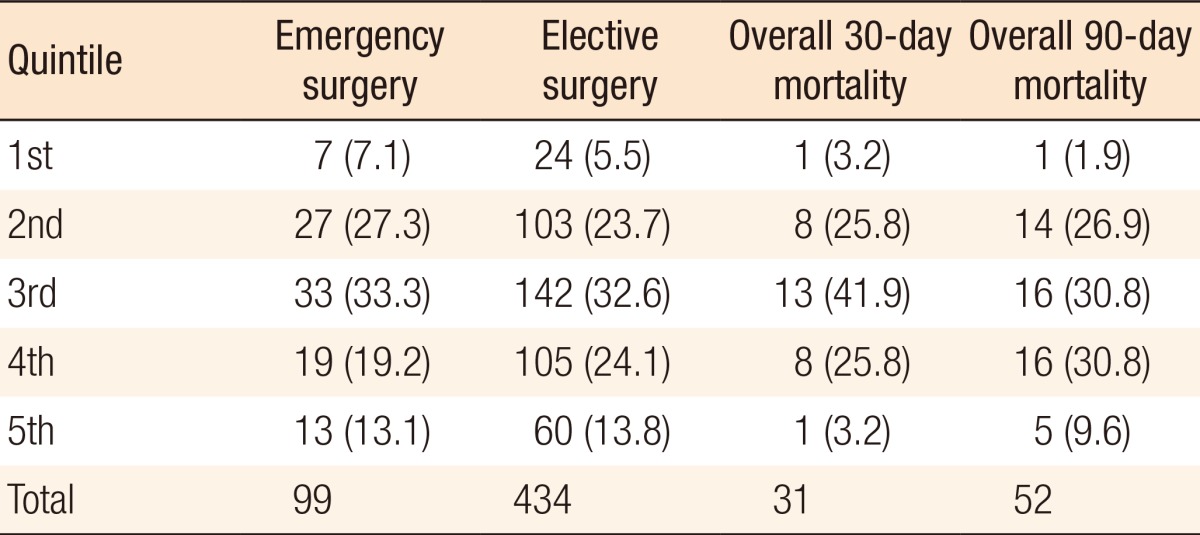
Table 3. Mode of surgery in relation to Index of Multiple Deprivation quintiles, with the 1st quintile being the least deprived, and the 5th quintile being the most deprived.

Values are presented as number (%).
No association was observed between the quintile and 30-day mortality (chi-square test for trend; P-value = 0.44) or 90-day mortality (chi-square test for trend; P-value = 0.49).
