Fig. 2.

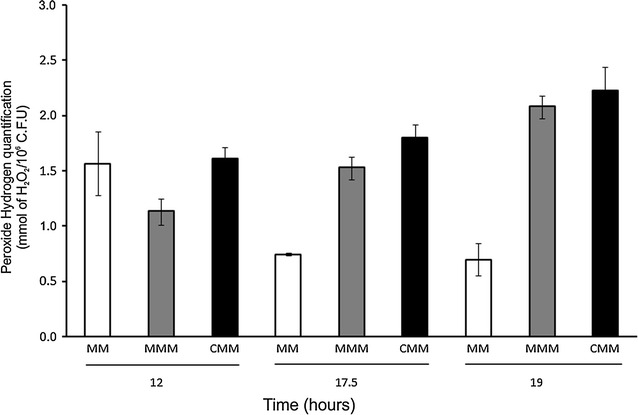
H2O2 quantification (representing oxidative stress) in control (MM)-, mesotrione (MMM)- and Callisto® (CMM)-treated cultures after 12, 17.5 and 19 h. Error bars represent standard errors on means

H2O2 quantification (representing oxidative stress) in control (MM)-, mesotrione (MMM)- and Callisto® (CMM)-treated cultures after 12, 17.5 and 19 h. Error bars represent standard errors on means