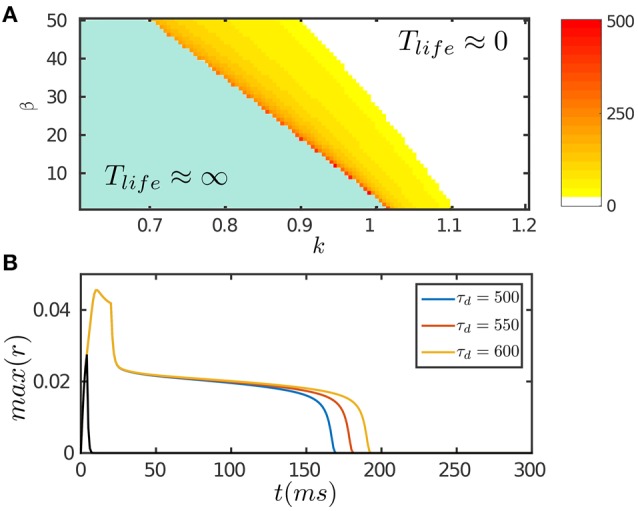
Figure 2.

Persistent activity of the network in response to a transient input. The input is given by Equation (8). (A) The phase diagram of the network with varying STD strength β and inhibition strength k. The network can hold persistent activity of finite lifetimes over a range of parameter values around the boundary. The lifetime of persistent activity, Tlife, is measured by the length of the decaying plateau. (B) The lifetime of persistent activity with the varying time scale of STD τd. β = 100. k = 0.12. The network holds persistent activity if the stimulation duration is long enough in the order of τf; otherwise the network response fades away rapidly as indicated by the black curve. Other parameters are: a = 0.5, J0 = 0.5, fmin = 0.1, α = 20, m = 2.5τ/τv, η = 40, τ = 1 ms, τf = 10 ms, τv = 80 ms, τg = 3500 ms, Aamp = 0.15.
