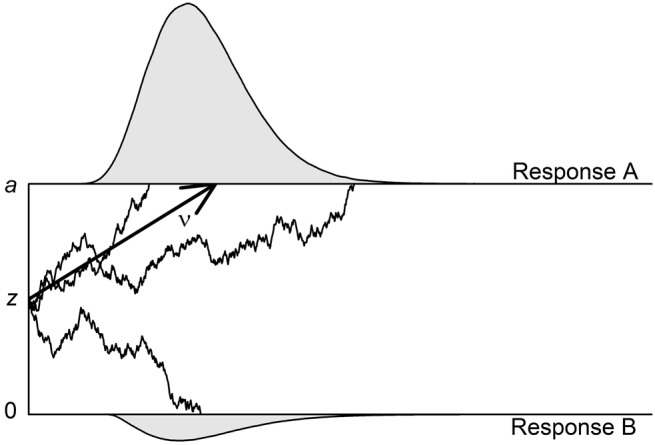
Figure 1.

Illustration of the diffusion model with three of its four main parameters. The two thresholds that are associated with Response A (upper threshold; correct response in this illustration) and Response B (lower threshold; erroneous response) are separated by the distance a. The accumulation of information starts at starting point z, which is here centered between the thresholds. The mean drift rate (ν) is positive so that the upper threshold is reached more often than the lower threshold. In two of the three exemplary trials, the processes reach the upper threshold—resulting in one fast and one very slow correct response—and in one trial, the process reaches the lower threshold. The non-decisional component (t0) as well as the intertrial variabilities (St0, Sν, and SZr) are not depicted.
