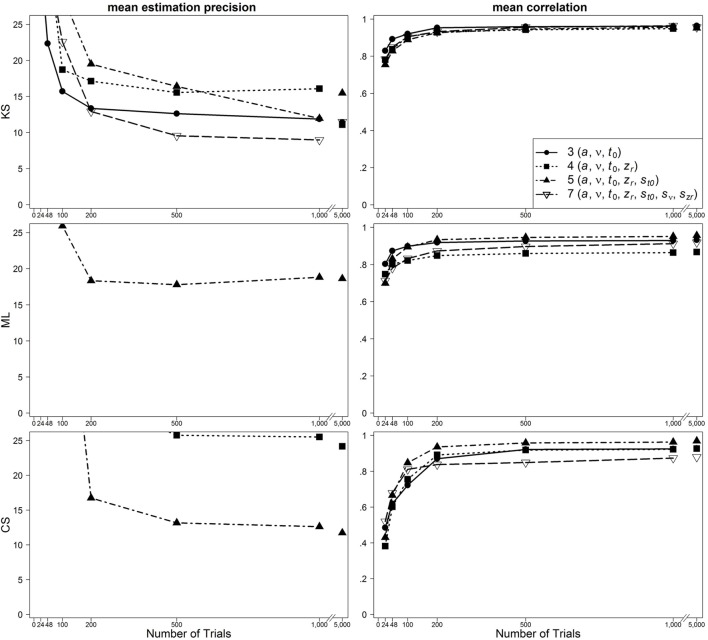
Figure 4.
Scatter plot of 95% quantiles of mean estimation precision (left column) and mean correlation between true and reestimated parameters (right column) for data sets with fast contaminants in the one-drift design. On the basis of data sets with at least 4% of trials at each threshold. Quantiles exceeding the mean estimation precision of 25 are not depicted.

