FIGURE 7.

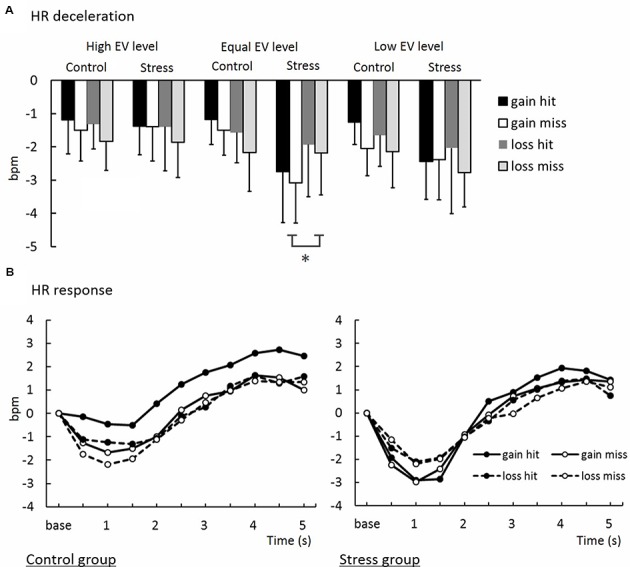
(A) Heart rate deceleration in decision-making task. ∗Significant difference between groups (p < 0.05). (B) Waveforms of time-series variations of HR deceleration.

(A) Heart rate deceleration in decision-making task. ∗Significant difference between groups (p < 0.05). (B) Waveforms of time-series variations of HR deceleration.