FIGURE 2.

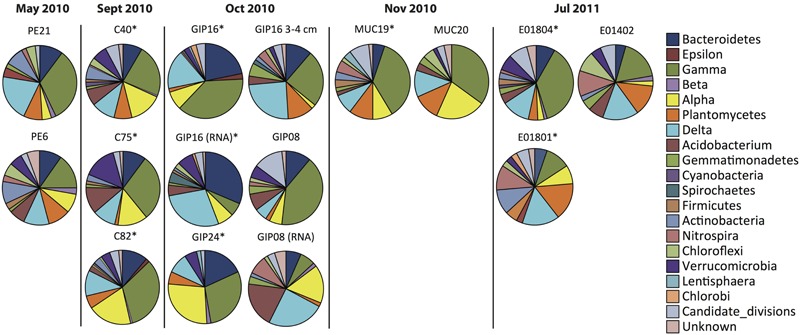
Phylum-level resolution pie chart plots of bacterial 16S rRNA gene clone libraries and reverse-transcript 16S rRNA clone libraries from oil polluted sediment samples (labeled with ∗) and control sites.

Phylum-level resolution pie chart plots of bacterial 16S rRNA gene clone libraries and reverse-transcript 16S rRNA clone libraries from oil polluted sediment samples (labeled with ∗) and control sites.