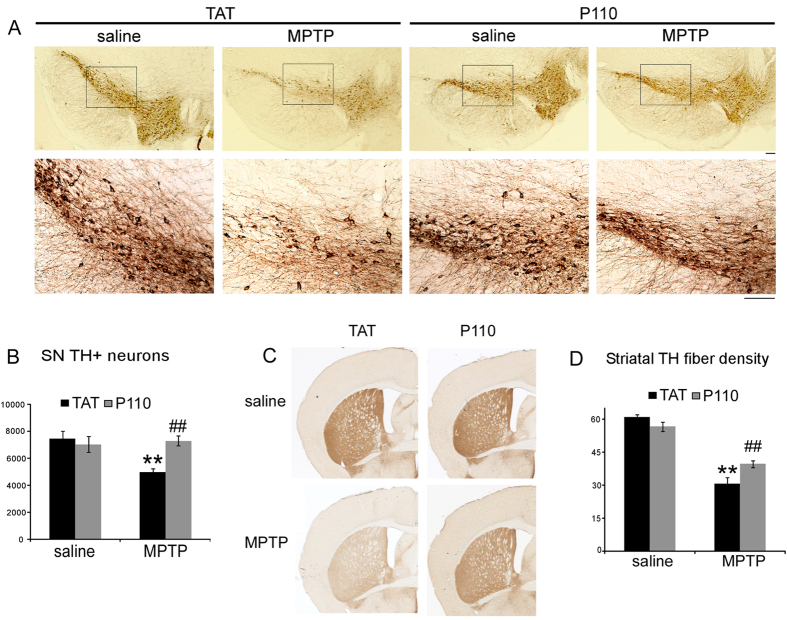
Figure 2. P110 (1.5 mg/kg/day) treatment results in neuroprotection in mice in a subacute MPTP model.
(A) Representative images showing immunohistochemical staining for TH in the ventral midbrain in saline or MPTP treated mice receiving TAT or P110 at 30 days after the last MPTP or saline injection. (B) The total number of SNpc DA neurons and (D) Total striatal TH immunoreactive optical density at 30 days after the last MPTP injection. (C) Representative images showing striatal TH immunostaining. **Indicates p < 0.01 for saline vs. MPTP administration, and ##Indicates p < 0.01 for TAT vs. P110, two-way ANOVA. (n = 6 in each group). Scale Bar = 100 μm.

