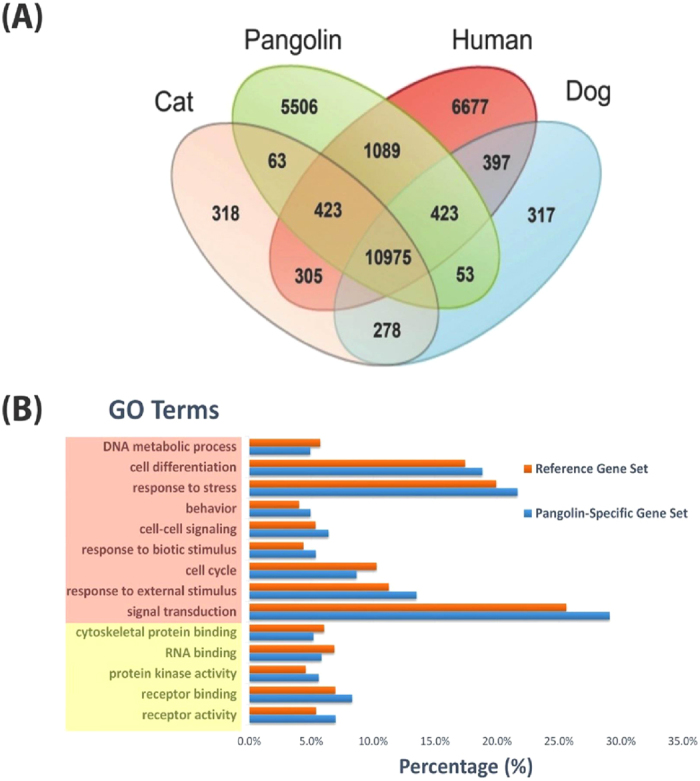
Figure 4. Comparative analysis.

(A) Venn diagram showing comparison between the genes of pangolin and other mammals. (B) Functional enrichment analysis of pangolin-specific genes. Significant functional categories were shown. GO terms highlighted in light red are biological processes, whereas GO terms highlighted in yellow are molecular functions.
