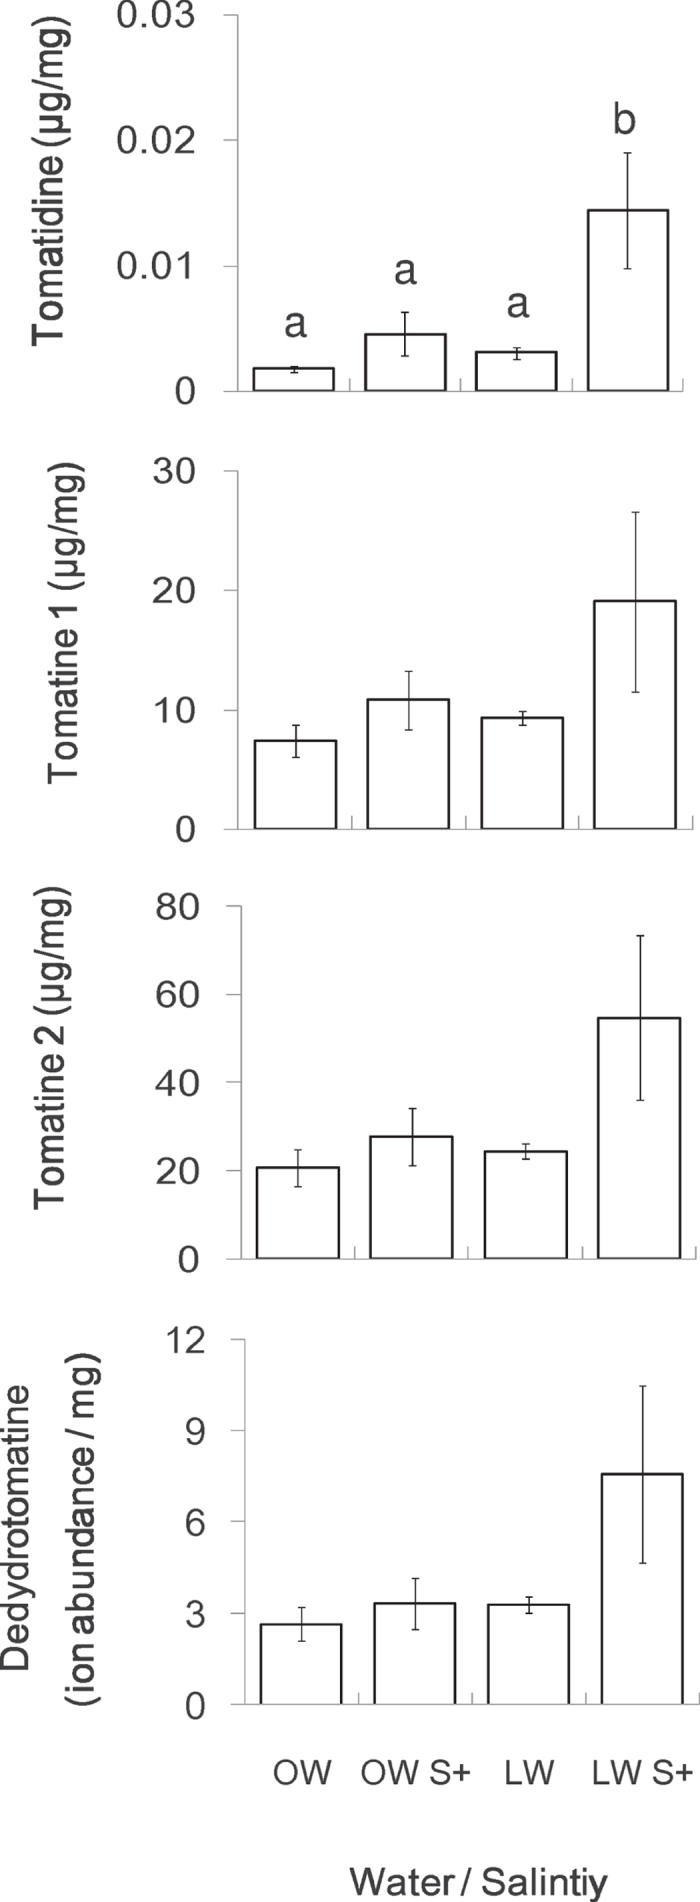
Figure 2. Effects of water and salt inputs on the concentrations of four glycoalkaloids in tomato leaves: tomatidine (μg/mg leaf dry mass (LDM)), α-tomatine 1 (μg/mg LDM), α-tomatine 2 (μg/mg LDM) and dehydrotomatine (x104) (relative content: ion abundance/mg LDM).

OW: optimal water; LW: limited water; OW S+: optimal water and salinity stress (100 mM NaCl); LW S+: limited water and salinity stress. Histograms with different letters indicate significant difference at P < 0.05. Absence of letters indicates no significant difference among water and salinity treatments.
