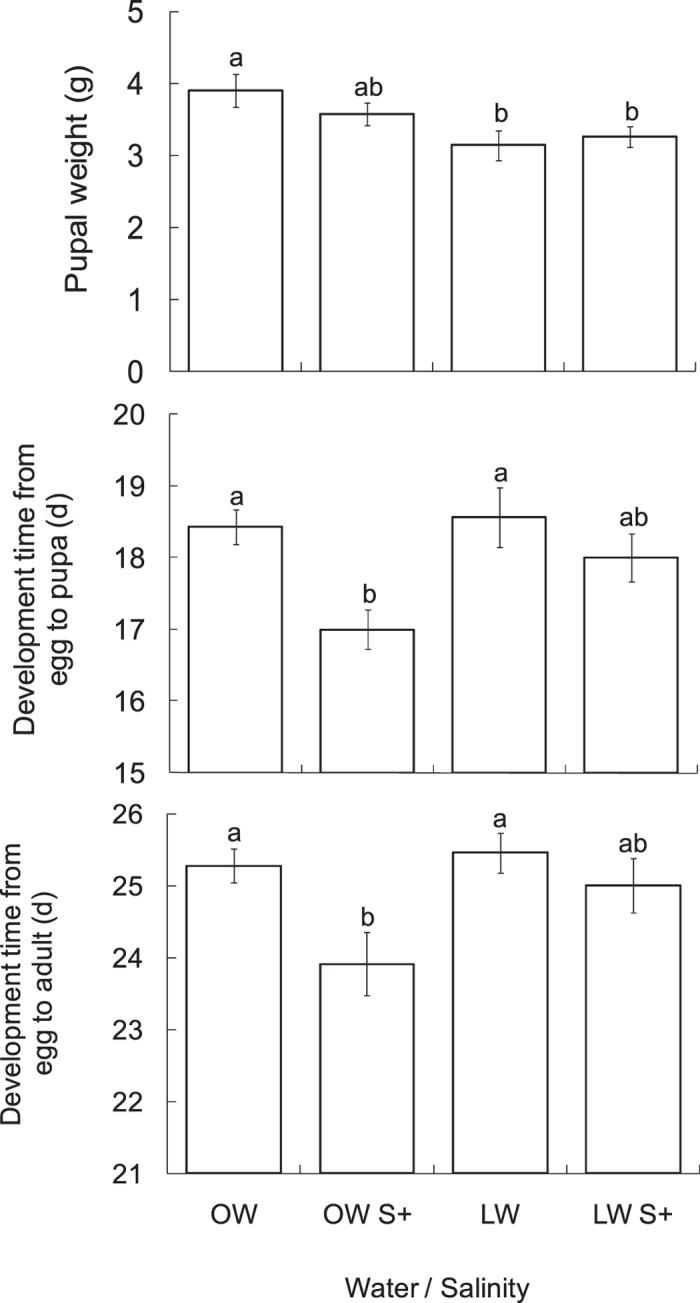
Figure 4. Pupal weight (mean ± SE, n = 13–15), development time from egg to pupa (mean ± SE, n = 13–16) and development time from egg to adult (mean ± SE, n = 11–13) of T. absoluta feeding on tomato plants treated with different water and salt inputs.

OW: optimal water; LW: limited water; OW S+: optimal water and salinity stress (100 mM NaCl); LW S+: limited water and salinity stress. Histograms with different letters indicate significant difference at P < 0.05.
