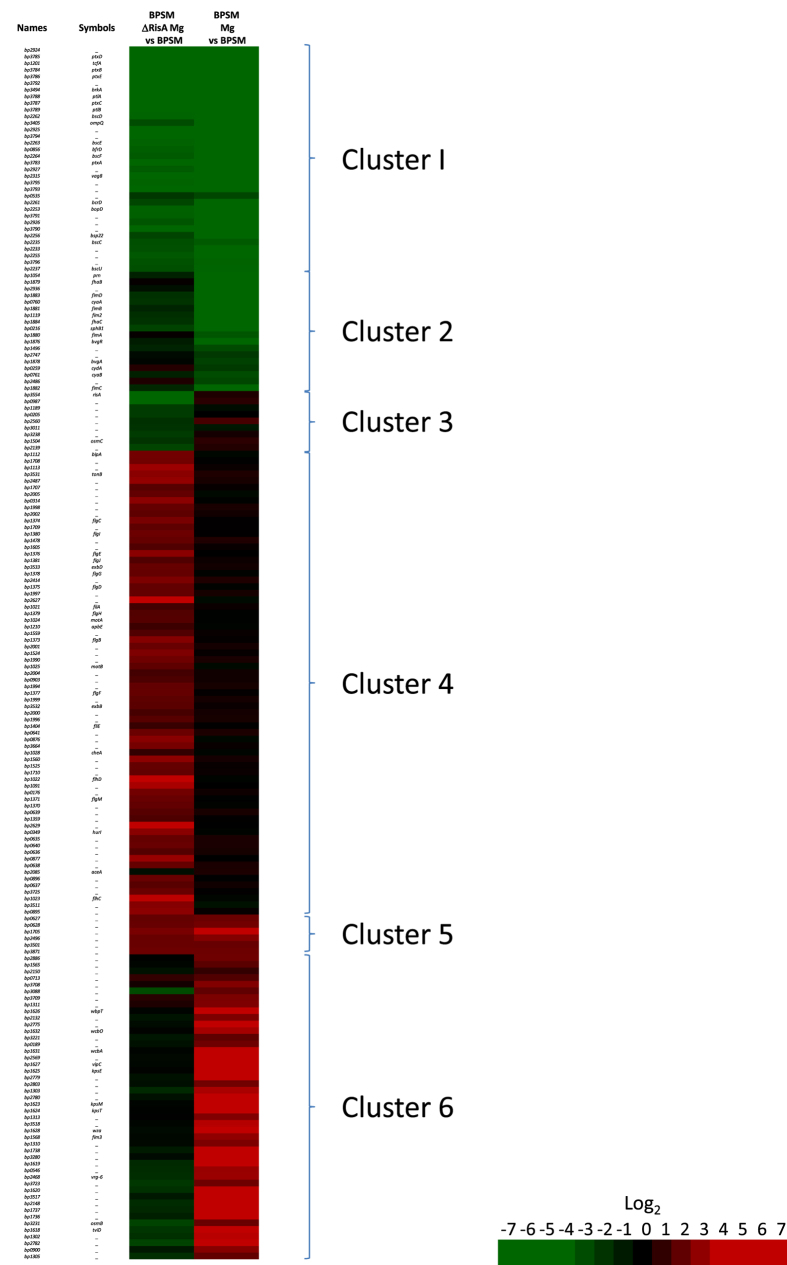
Figure 3. Heat map of RisA-regulated gene expression in modulating conditions.
Rows correspond to array probes. The names and symbols in the left column correspond to the Tohama I Sanger Centre annotation. BPSMΔRisA Mg vs BPSM corresponds to the ratios between BPSMΔRisA cultivated in the presence of 50 mM MgSO4 and BPSM cultivated in non-modulating conditions. BPSM Mg vs BPSM corresponds to the ratios between BPSM cultivated in the presence of 50 mM MgSO4 and BPSM cultivated in non-modulating conditions. The indicated ratios are the means of all the experiments. Red, increased transcript abundance; green, decreased transcript abundance; black, no significant change in transcript abundance; the level of transcript abundance is defined by the coloured Log2 scale.

