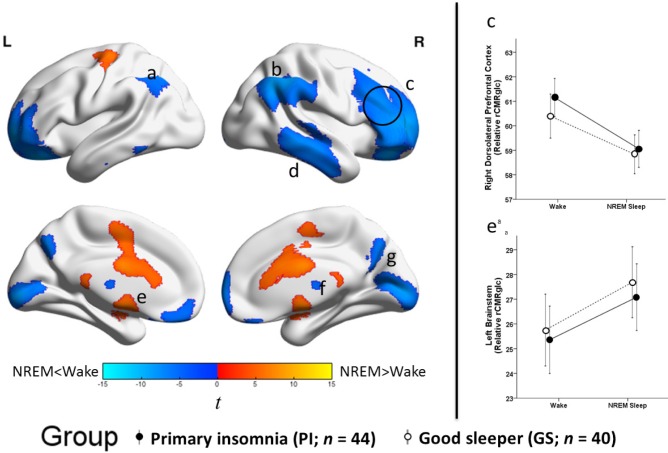
Figure 3.
Sleep-wake state differences in relative regional cerebral metabolic rate for glucose, independent of group. We compared relative regional cerebral metabolic rate for glucose (rCMRglc) in the total sample, 44 patients with insomnia (PI) and 40 good sleeper controls (GS), during nonrapid eye movement (NREM) sleep to that during wake. The color bar represents t values; blue indicates regions where rCMRglc was relatively lower during NREM sleep than wake, and orange indicates regions where rCMRglc was relatively higher during NREM sleep than during wake. Relative rCMRglc was significantly lower during NREM sleep than wake in regions of the (a) left inferior parietal lobule, (b) right inferior parietal lobule, (c) bilateral prefrontal cortex, (d) right temporal cortex, (f) bilateral thalamus, (g) bilateral occipital cortex. Relative rCMRglc was significantly higher during NREM sleep than during wake in regions of the (e) bilateral brainstem/basal ganglia/cingulum/motor areas. All clusters were significant at PFWE_corrected < 0.05. A full list of significant regions is presented in Table 5. We extracted the voxelwise data from anatomically distinct regions of the circled clusters, (c) the right dorsolateral prefrontal cortex and (e) the left brainstem (a not depicted), and plotted these data to the right. The closed circles connected with a solid line represent extracted average relative glucose metabolism from the respective regions for PI, and the open circles connected by a dotted line represent GS. Error bars represent the 95% confidence interval computed voxelwise within each cluster. L = left; R = right.

