Figure 4.
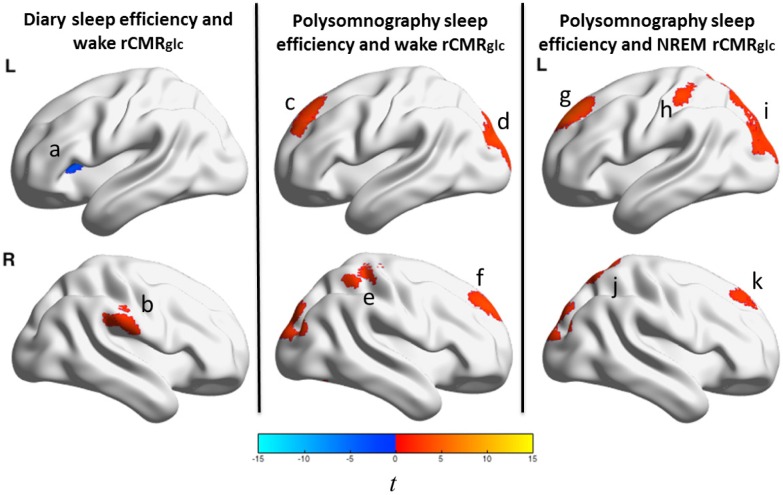
Sleep efficiency and relative regional cerebral metabolic rate for glucose in patients with insomnia. We tested associations between sleep efficiency (sleep diary and polysomnography assessed) and relative regional cerebral metabolic rate for glucose (rCMRglc) during wake and nonrapid eye movement (NREM) sleep in a sample of 44 patients with primary insomnia (PI). The color bar represents t values; orange indicates regions where sleep efficiency negatively correlated with relative rCMRglc and blue indicates regions where there was a positive correlation. Lower sleep diary-assessed sleep efficiency was associated with (a) lower relative rCMRglc during wakefulness in the left anterior insula and (b) higher relative rCMRglc during wakefulness in the right supramarginal gyrus (left panel). Sleep diary-assessed sleep efficiency was not associated with relative rCMRglc during NREM sleep. Lower polysomnography-assessed sleep efficiency was associated with higher relative rCMRglc during wakefulness in regions of the (c) left superior frontal gyrus, (d) occipital gyri, (e) right inferior parietal lobule/postcentral/precentral gyri, and (f) right superior frontal/medial frontal gyri (middle panel). Lower polysomnography-assessed sleep efficiency was associated with higher relative rCMRglc during NREM sleep in regions of the (g) left superior frontal/medial frontal gyri, (h) left postcentral gyrus, (i) bilateral superior parietal lobule/occipital gyri, (j) right superior parietal lobule/postcentral/precuneus gyri, and (k) right superior frontal/medial frontal gyri (middle panel). All clusters were significant at P3DC_corrected < 0.05. A full list of significant clusters and brain regions involving these clusters is presented in Table 6. L = left; R = right.

