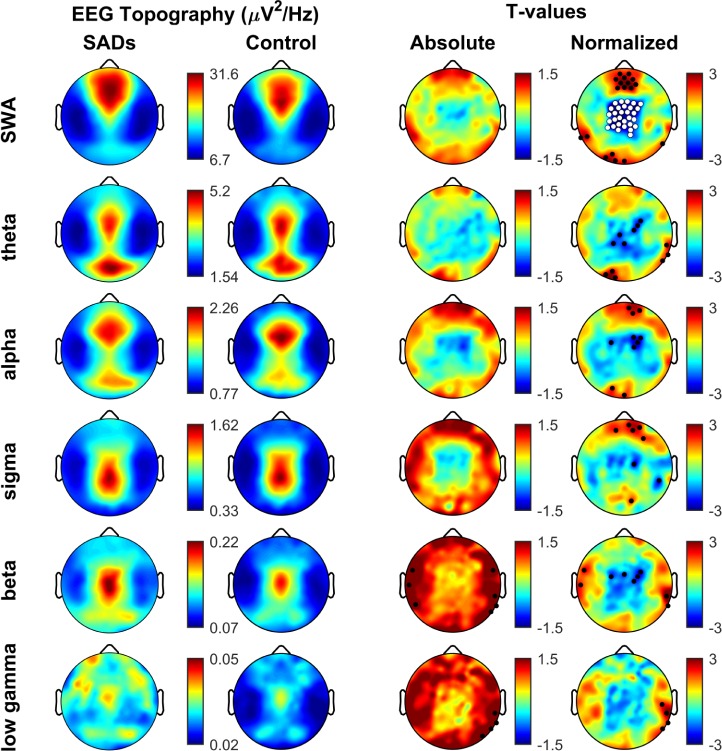
Figure 1.
Topographical analysis of N2N3 sleep EEG. Topoplots showing the regional decrease in normalized SWA power in patients (SADs) versus healthy controls. Rows represent frequency bands of interest as indicated: SWA (1–4 Hz), Theta (4–8 Hz), Alpha (8–12 Hz), Sigma (12–15 Hz), Beta (15–25 Hz), Low Gamma (25–40 Hz). First column: average NREM sleep EEG topographies across frequency bands for SADs subjects. Second column: topographical averages for healthy control matches during NREM sleep, scaled the same as SADs subjects. Third column: Map showing the individual electrode t-value (two-tailed, unpaired) maps for the comparison between SADs and control subjects in terms of absolute power. Blue values represent a decrease in absolute EEG power in SADs subjects relative to controls (SADs < control) and red values represent an increase (SADs > control). Fourth column: Same as third column except that each subject was spatially normalized using the z-score across electrodes before creating the t-value comparison. White dots indicate channels that belong to a statistically significant cluster of electrodes (P ≤ 0.05) using statistical nonparametric mapping suprathreshold cluster testing. Black dots indicate individual channels with P < 0.05 (uncorrected).

