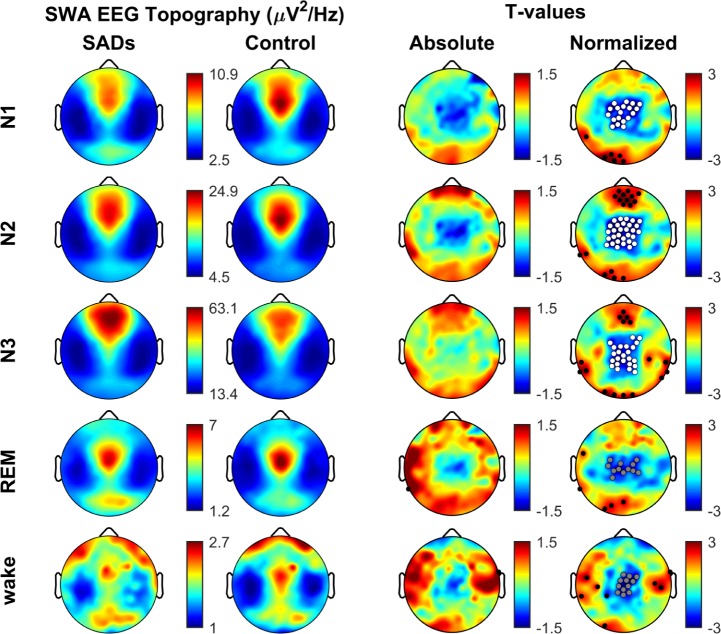
Figure 2.
SWA topography across the sleep/wake cycle. Same as Figure 1 except only SWA band is shown (1–4 Hz), this time across different phases of the sleep/wake cycle (wake, N1, N2, N3, and REM). Note similarity between sleep/wake phases (fourth column) and consistent differences between groups (clusters of white and gray dots) regardless of the sleep/wake phase. White dots belong to significant clusters (P < 0.05) using SnPM for multi-comparison correction. Gray dots belong to clusters with a trend for significance (P ≤ 0.08). Black dots indicate individual channels with P < 0.05 (uncorrected). Note, wake group comparison was for 14 SADs vs matched controls due to the availability of waking data. See text for details.

