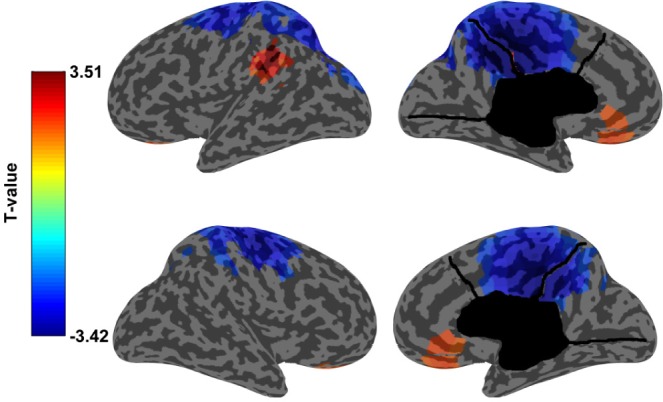
Figure 3.

Regional decrease in normalized SWA power. Inflated cortical map showing the results for SWA power source analysis using artifact- and arousal-free 5 minute segments selected from N3. On the top left: lateral surface of the left hemisphere. On the bottom left: lateral surface of the right hemisphere on the bottom left, on the top right: medial surface of the left hemisphere, on the bottom right: medial surface of the right hemisphere. In blue the T-values of the areas that were significantly different (P < 0.05) between SADs and healthy controls using SNPM cluster test. Functional areas that are most significantly different include the cingulate cortex (Brodmann areas: 23, 24, 29, 31), motor and premotor/supplementary motor cortices (Broadmann areas: 4 and 6), primary and associative somatosensory cortices (Broadmann areas: 2, 3 and 5), visual associative cortex (Brodmann areas: 18 and 19) and parietal multi-modal associative cortex (Brodmann area: 7). In red the areas where the increase in SWA power was significantly different (P < 0.05) between SADs and healthy controls at the uncorrected voxel-level.
