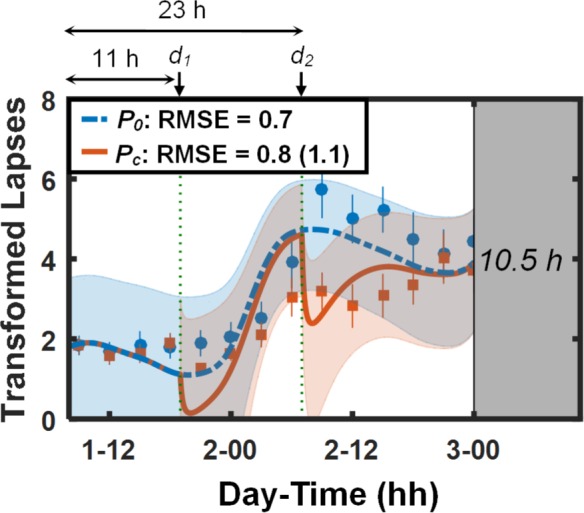
Figure 4.

Group-averaged and standard errors of transformed psychomotor vigilance task (PVT) lapse () data, along with unified model of performance (UMP) predictions for study conditions 7 and 8 (Table 1) in study V4.8,15 Thin dotted vertical lines denote caffeine intake (d1 = 200 mg and d2 = 200 mg). Other descriptors are identical to those in Figure 1. δ = −2.3 lapses, RMSE1 = 0.2 lapses, and RMSEr = 0.7 lapses.
