
Figure 1.
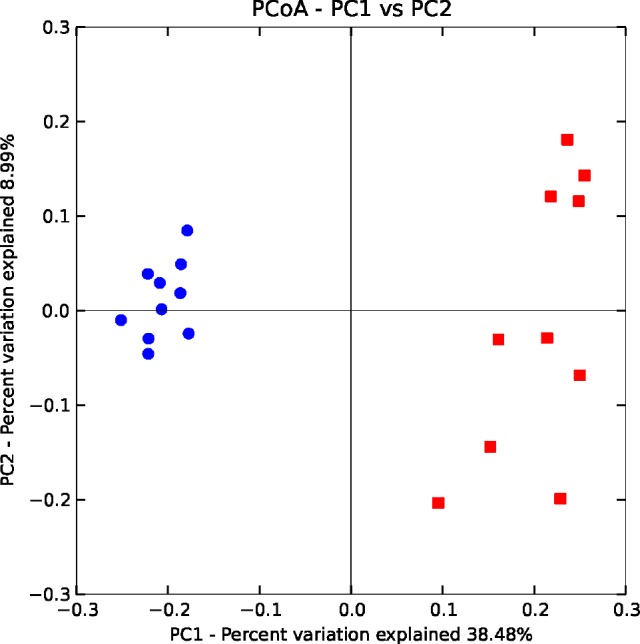
Clustering of fecal bacterial communities after normoxic recovery by principal coordinate analysis (PCoA) using unweighted UniFrac distances. The position of the bacterial communities for each genus along the two first principal coordinate axes (PC1 versus PC2) are illustrated, along with the percentage of variation explained by each axis. Axis 1 (PCoA1): 38.48% of variation explained; Axis 2 (PCoA2): 8.99% of variation explained. Intermittent hypoxia (IH) samples (n = 10) are represented by blue dots and normoxic control (NM) samples (n = 10) are represented by red squares.