
Figure 2.
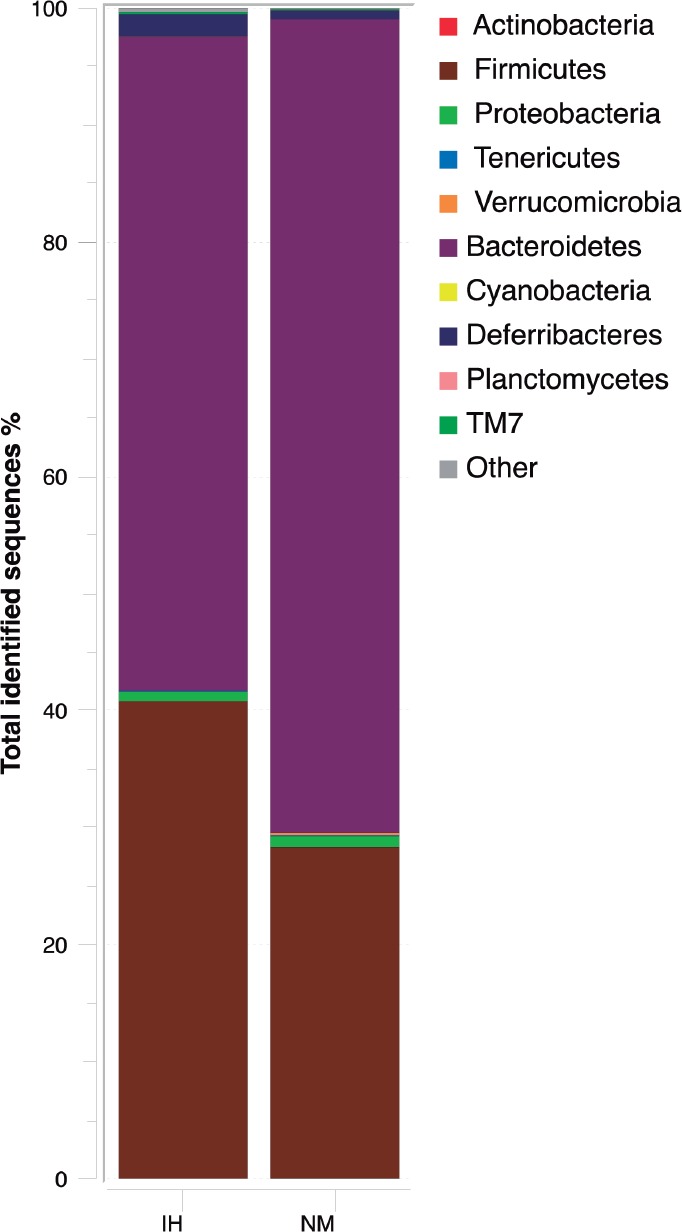
Phylum-level distribution of bacteria in fecal samples of intermittent hypoxia (IH) and normoxic controls (NM) after normoxic recovery obtained by pyrosequencing analysis of the V2-V3 region of the 16S ribosomal RNA gene. Changes in the relative abundance (%) of major phylum-level taxa after normoxic recovery in both study groups are represented. Data are shown as percentage of the total identified sequences per group.