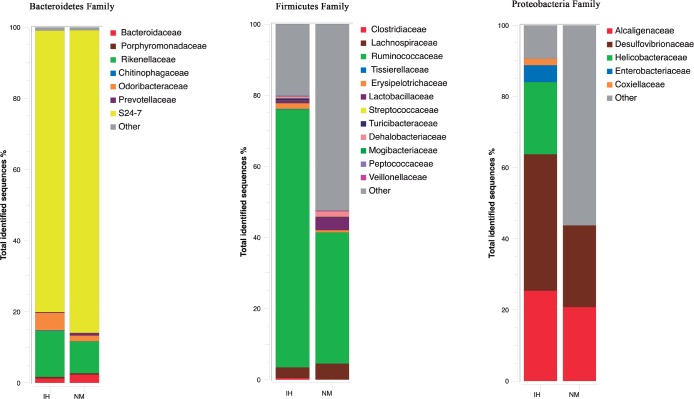
Figure 3.
Microbial community structure at the family level using pyrosequencing data in the feces of intermittent hypoxia (IH) and normoxic controls (NM) after normoxic recovery. Changes in the relative abundance (%) of major families after normoxic recovery in both study groups are shown. Data are shown as percentage of the total identified sequences per group.

