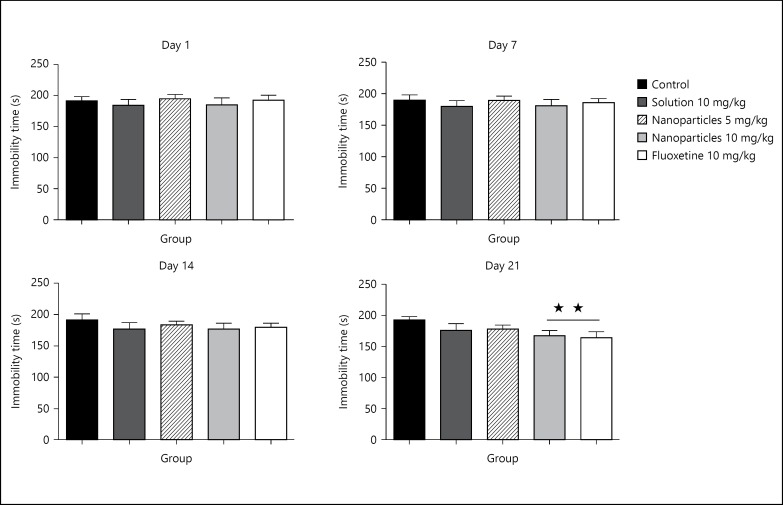
Fig. 5.
Effect of treatment on the immobility time on days 1, 7, 14 and 21. The immobility time was measured for 30 min, half hour after treatment on days 1, 7, 14 and 21. Data are presented as mean ± SD, with 8 rats per group (one-way ANOVA followed by Tukey test). Total degree of freedom = 39. p < 0.05: no symbol, * p < 0.05, ** p < 0.01, *** p < 0.001.

