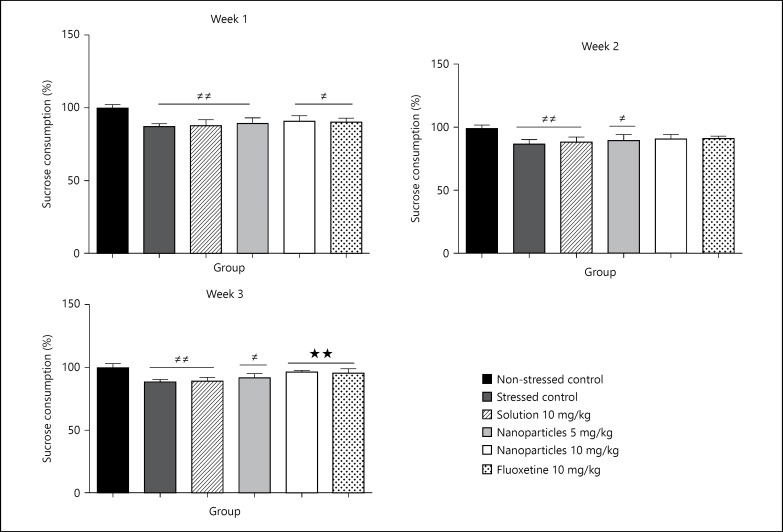
Fig. 7.
Effect of treatment on the sucrose consumption 1, 2 and 3 weeks after starting treatment with the corresponding drugs (non-stressed control, stressed control, L-tyrosine solution 10 mg/kg, L-tyrosine nanoparticles 5 mg/kg, L-tyrosine nanoparticles 10 mg/kg, fluoxetine 10 mg/kg). Sucrose consumption was measured for 1 h, half hour after treatment. Data are presented as mean ± SD, with 8 rats each group (one-way ANOVA followed by Tukey test). Total degree of freedom = 47. # The significant difference between non-stressed control and rest of groups. * The significant difference between stressed control and rest of groups except non-stressed control. p < 0.05: no symbol, *, # p < 0.05, **, ## p < 0.01, ***, ### p < 0.001.

