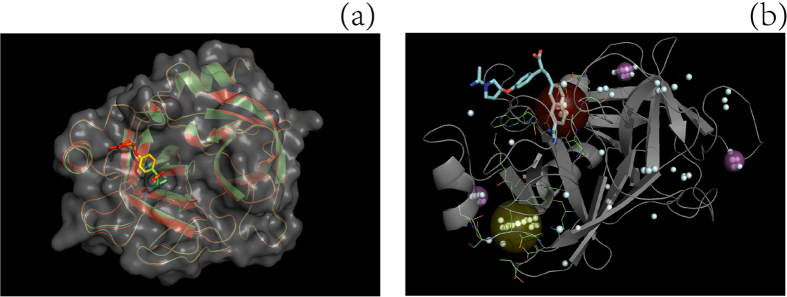
Figure 3. Comparison of the performance of different methods in predicting the ligand-binding site of a protein (ID: 2TGA).
(a) illustrates how ligand coordinates and atomic connectivity information for ligand-unbound structures can be obtained from their corresponding ligand-bound proteins: A ligand-bound protein, 1MTW.pdb (red model), is aligned to the ligand-unbound protein, 2TGA.pdb (green model), using PyMOL, and the coordinates of the ligand DX9 (stick model) are then saved in the pdb file of 2TGA.pdb. The actual ligand-binding sites are the first, fourth, and fifth cavities after re-ranking by MF-PLB, PLB, and Ligsite-csc, respectively; thus, only MF-PLB successfully identifies the ligand-binding site as the top 1 hit. The MF-PLB for the actual ligand-binding site is 13.74, whereas the PLB for the actual ligand-binding site is only 11.36. The MF-PLB value of the first cavity re-ranked by the PLB (yellow ball; this cavity is also the first cavity re-ranked by Ligsite-csc) is 13.22, whereas the PLB of the cavity is 12.7. The other three cavities in the top 5 hits after re-ranking by Ligsite-csc are shown as purple balls, and all pocket grids calculated by Ligsite-cs are shown as cyan grids.

