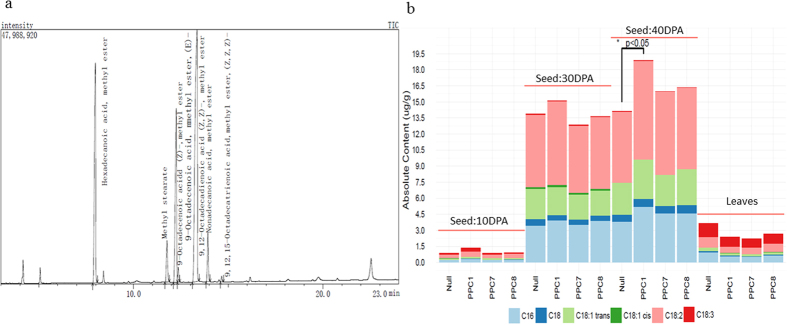
Figure 4. GC-MS determined the fatty acid composition of transgenic GhPEPC1 lines and null plants.
(a) GC-MS profile of fatty acid composition in 30DPA (days postanthesis) cottonseed. (b) Fatty acid profile in transgenic and null cottonseed and leaves at different development stages. Fisher’s exact test, *P value < 0.05.

